• Skip to primary navigation
  • Skip to main content
  • Skip to primary sidebar
  • Skip to footer

A Social Democratic Future

Policy paths towards equality and efficiency

  • Home
  • Investing in productive infrastructure
  • Wider Housing Ends
  • Covid
  • 2018 Housing Policy
  • Consultation Responses
  • News

Housing

Labour’s Planning Reforms: Ends and Means

8th February 2025 by newtjoh

The first section broadly sets out the government’s planning reforms, before explaining and discussing in more detail the inter-connected changes made to the Standard Method (SM) and the National Planning Policy Framework (NPPR or framework), including the presumption to sustainable development, affordable housing provision, and future housing development on Green Belt (GB) land.

Acting in combination they will bring more local planning authorities into the scope of that presumption and hence the ‘tilted balance’ in the short-term.

The second, after summarising the main reasons why the government’s overarching 1.5m delivery target will not be met, goes on to explain why planning reform is a necessary but far from sufficient condition to achieve a more realistic, yet still momentous, sustainable annual 300,000 delivery target in England, which will depend (uneasily) upon:

  1. The expected or perceived direction and state of the national economy;
  2. The drivers of the private speculative business plan model, largely predicated on maximizing profit margin rather than volume delivery;
  3. The availability of public funding to support new affordable housing provision, most of which under current arrangements comprise front-loaded grant, counting against public borrowing and debt making it subject to the new government’s new fiscal framework;

The third, and concluding section, identifies the core dilemma that the government faces: the operation of the current private and public delivery systems are largely inimical to the achievement of its target, but it also needs to harness the support of the private sector and to navigate its own fiscal rules.  

The argument is made that although in the short- to medium-term, current housing market conditions may require the government to be pragmatic in its policy responses in response to that dilemma, its embryonic tilt towards a partial contracting model, represented by its introduction of ‘golden rules’, its treatment of benchmark land values (BLV) and viability (at least introduced in the July consulted NPPF version and now subject to review), and continuing changes to compulsory purchase compensation framework (also subject to consultation) should be sustained and developed, notwithstanding short-term pressures to abort them.

When progressed in parallel with demonstration Mayoral and other development corporation demonstration projects where they are both most needed and economically and socially productive, they would help to build the foundations of higher sustained levels of housing delivery conducive to higher growth and housing opportunity, even though that will take time with benefits primarily realised in the next, rather than this parliament, when at least they could begin to become tangible.

 1            Labour’s planning reforms and the 2024 NPPF   

Within a month of becoming the Housing and Communities Secretary, Angela Rayner, announced to parliament on 30 July 2024 the new government’s planning reforms, summarised in her letter that day to local authorities.

The following day the Ministry of Housing and Local Government (MHCLG) published a draft revised NPPF (July or consultedNPPF 2024), accompanied with a consultation, which closed on 24 September 2024.

Other supporting changes to the planning system were published in parallel, most notably a revised and new standard method (SM) methodology to assess local housing need.

On the 12 December, the government published its response (response or consultation response) to its July consultation alongside the December 2024 NPPF (December 2024 or new NPPF – see tracked changes to it and to previous government’s December 2023 iteration version for granular detail, while  ASocialDemocraticFuture’s submission includes some policy commentary)

The new NPPF became operative immediately on 12 December 2024 for Local Planning Authority (LPA) decision-making and from 12 March 2025 for plan-making purposes.

It will, however, not apply to emerging local plans submitted for examination by the Planning Inspectorate (PI) or are subject to Regulation 18 or 19 consultation on or before 12th March 2025 (see sub-section on transitional arrangements below).

Associated revisions to extant planning guidance documents to make them consistent with the new NPPF were also made and published.

This timely turnaround was to allow changes “to be made as soon as possible” to support the government’s commitment to deliver 1.5m additional dwellings by the end of this parliament (housing delivery target or target).

In headline summary terms, the new NPPF, according to the planning update published by MHCLG on the 13 December:

  • Makes housing targets mandatory and reverses, confirming the reversal of the December 2023 changes to the NPPF made by the previous government (see tracked changes version above);
  • Implements a new standard method formula to ensure local plans are in line with the Government’s manifesto commitment of 1.5 million new homes in this Parliament;
  • Confirms transitional arrangements for local plans in the existing system;
  • Defines grey belt land within the Green Belt, to be brought forward for homes and other   important development through both plan and decision-making;
  • Defines new ‘golden rules’ for land released in the Green Belt to ensure release delivers in the public interest, as well as the policy considerations of affordable housing, design quality, and sustainable locations that are part of the presumption in favour of sustainable development;
  • Makes wider changes to ensure that local planning authorities are able to prioritise the types of affordable homes their communities need, and that the planning system supports a more diverse housebuilding sector;
  • Supports economic growth in key sectors, including laboratories, gigafactories, data centres, digital economies, and freight and logistics – given their importance to our economic future;
  • Delivers community needs to support society and the creation of healthy places and adopting a ‘vision led’ approach to transport planning.

The update also announced the launch of clearing services to be provided by Homes England to match developers with housing associations with section 106 affordable home obligations (S106 or AHO) committed contractually by developers but without a purchasing partner. Details of unsold S106 dwellings will be circulated for registered providers and local authorities to search.

According to a January 2025 Homes England release this new scheme has already attracted much interest. Where effective and timely matching of AHOs prevent the loss of additional social housing and expedite the progression of projects, this should help to make inroads into the ballooning cost of temporary accommodation (TA) as well as contribute to the government’s delivery target. It, however, is a necessary palliative response to a symptom of system failure rather than a strategic change.

A Ministerial Statement (12 December statement) set out the other main strands of the government’s planning reform agenda that in the main were presaged in the Labour 2024 manifesto.

A Planning and Infrastructure Bill was announced to further speed up and streamline the planning process, as well as to “to build more homes of all tenures and to accelerate the delivery of major infrastructure projects”.

The government confirmed in January 2025 that it will be introduced in the spring and its business managers will expedite its passage through parliament.

It will include proposals, currently subject to MHCLG Planning Committee and Brownfield passport working papers, to “modernise and speed up” local decision making and to fast track brownfield development, as well as measures to accelerate the progress of Nationally Significant Infrastructure projects.

Other secondary legislation will also be introduced, subject to consultation, to implement powers that the previous government brought forward under the Levelling Up and Regeneration Act (LURB 2023) to require developers “to commit to a build out trajectory upfront and report on delivery against it”, and to empower LPAs to decline to determine applications from developers with a poor record of delivery.

Angela Rayner’s 30 July letter (see previous link) had earlier highlighted that housing need in England cannot be met “without planning for growth on a larger than local scale”.

It heralded the introduction of effective new mechanisms for cross-boundary strategic planning on a universal scale, taking account of “both the appropriate geographies to use to cover functional economic areas, and the right democratic mechanisms for securing agreement”.

Such mechanisms would encompass the development and agreement of mayoral Spatial Development Strategies (SDSs) possessing the formal status of development plans (akin to the statutory London Plan), as well as effective new mechanisms to further cross-boundary strategic planning to allow “all Combined and Mayoral Authorities strategically plan for housing growth across their areas”.

In support of that aim, paras 24 and 27 of the new NPPF confirms that effective strategic planning across local planning authority boundaries “will play a vital and increasing role in how sustainable growth is delivered by addressing key spatial issues including meeting housing needs, delivering strategic infrastructure and building economic and climate resilience.”

While LPAs and county councils (in two-tier areas) will continue to be under a duty to cooperate with each other, and with other prescribed bodies, strategic policymaking authorities on strategic matters that cross administrative boundaries are now more actively encouraged to align their plan policies as fully as possible with other authorities and relevant bodies to ensure a consistent approach is taken to planning the delivery of major infrastructure.

Unmet development needs from neighbouring areas are provided for in accordance with new NPPF para 11b: that is: “as a minimum, provide for objectively assessed needs for housing and other uses, as well as any needs that cannot be met within neighbouring areas, (according to footnote six) as “established through statements of common purpose”.

On the 16 December a Devolution White Paper was published proposing substantive and far-reaching institutional reform that, if realised and implemented, would replace the rather ‘add-on’ existing duty to co-operate with overarching arrangements, where, in effect, it would be embedded internally within the new strategic reformed authorities: the keystone of the reform.    

A combined – or strategic – authority is a legal body that enables a group of two or more councils to collaborate and to take collective decisions across council boundaries.

For example, Greater Manchester Combined Authority comprises its ten metropolitan districts joined by its directly elected mayor, Andy Burnham, as its chair and eleventh member. It is thus a Mayoral-led Combined Authority.

Cambridgeshire and Peterborough Combined Authority, established since 2017, is made up of a directly elected Mayor and seven constituent authorities, including Cambridgeshire County Council, Cambridge and Peterborough City Councils and district councils (referred to as the Constituent Councils) and the Business Board (Local Enterprise Partnership):

All future strategic authorities, according to the white paper, will belong to one of the following levels:

  • Foundation Strategic Authorities: these include non-mayoral combined authorities and combined county authorities automatically, and any local authority designated as a Strategic Authority without a Mayor;
  • Mayoral Strategic Authorities: the Greater London Authority, all Mayoral Combined Authorities and all Mayoral Combined County Authorities will automatically begin as Mayoral Strategic Authorities;
  • Those who meet specified eligibility criteria may be designated as Established Mayoral Strategic Authorities, unlocking further devolution, most notably an Integrated Settlement (see below).

The government’s strong preference is for partnerships that bring more than one local authority together over a large geography. In exceptional circumstances the Secretary of State will have the power to designate an individual local authority as a Foundation Strategic Authority only.

The government’s ambition remains for all parts of England to ultimately have a Mayoral (and eventually Established Mayoral) Strategic Authority. 

To that end, new statutory strategic authorities will be created, preferably Mayoral, serving a minimum population of 1.5m people, as part of universal coverage of strategic authorities across England where “councils work together, covering areas that people recognise and work in”.

Existing Mayoral strategic authorities will be accorded greater provision and funding powers, possibly covering health services, as well as planning and housing, so building upon the incremental reforms that previous administrations had put in hand fitfully since 2014 to devolve powers to city regions led by directly elected Mayors.

On 30 January 2025, Angela Rayner confirmed that Greater Manchester (receiving £630m) and the West Midlands Mayoral authorities (the previous pilots) will receive integrated settlements for the period covering the financial year 2025-2026, while North East, Liverpool City Region, West Yorkshire and South Yorkshire Mayoral Combined Authorities will do so from the 26-27 onwards. The government meanwhile is also “exploring how the settlement policy could be applied for the Greater London Authority”.  

Integrated settlements involve the central allocation of multi-year ‘unified pot’ funding allocations that the recipients can choose to switch between or to prioritise services and projects locally, freed of central Treasury and central government ‘micromanagement’ control.

Lower down the scale, proposals will also be invited from all the remaining two-tier council areas to reorganise into a unitary authority, as well as from those unitary councils “where there is evidence of failure or their size or boundaries may be hindering their ability to deliver sustainable and high-quality services to their residents”.

Such reorganised one-tier unitary authorities will be expected preferably to serve a population of around 500,000 and to align their public service boundaries with strategic authorities, leading, at least according to the white paper, “to fewer politicians and a more efficient state”, as well as to administrative cost savings.

A possible problem could be that some two-tier authorities could propose to form combined authorities preserving existing authorities although the new authorities may not correspond to a functional wider travel to work economic area nor involve much in the way of financial savings. Other consideration to be navigated, include maintaining democratic accountability and involvement at the local level.

All areas, with or without a strategic authority, to further the government’s will also be required to produce a Spatial Development Strategy (SDS) – once they have won support from a majority of their constituent members.

Meanwhile, the government intends to work with existing Mayoral combined authorities to explore extending their existing powers to develop SDSs.

It will also identify priority groupings of other authorities where strategic planning – especially the sharing of housing need – can be more immediately progressed to maximise collaborative benefits, engaging directly with the authorities concerned to structure and support such cooperation, but will use powers of intervention, as and where necessary.

Some of this institutional reform agenda, of course, is hugely ambitious. Much could change as things come out of the wash during the consultative and implementative phases.

Although potentially transformative in planning, funding, and institutional terms, it will also be demanding and thus potentially disruptive in its legislative, policy and resource inputs at both national and local levels: a bit like the aborted Infrastructure Levy (IL), but much larger and deeper.

That said, unlike the IL, there does also seem some real appetite to embrace the change at the local level with many authorities responding to the MHCLG July 2024 invitation to join the devolution ‘fast track’, the results of which were announced in January 2025, covering Norfolk and Suffolk, Sussex, and Cumbria areas amongst others.

The changes will be legislated for in a forthcoming English Devolution Bill.

MHCLG also published on the 19 December 2024 proposals and a consultation to streamline and extend the coverage of Section 190 of LURB 2023.

It already allows the removal of the uplift of value associated with the prospect of planning permission (“hope value”) from the assessment of compulsory purchase compensation on sites where affordable housing or other social health and educational infrastructure is to be provided and a public interest justification exists.

The proposed focus is on brownfield land in built-up areas, and on other land suitable for housing delivery where no extant planning permission for residential development exists, where a “significant amount of suitable land available for housing which is currently lying vacant or underutilised and not coming forward for development or, where it is coming forward for development, the provision of affordable housing offered on those sites is below the minimum ask of the local authority”.

This consultation, which closes on 13 February 2025, invites views as whether a general power, rather than relying on case-by case ministerial directions as under LURB, should be further introduced to enable the Secretary of State in England or the Welsh Ministers in Wales to make a direction to remove hope value from the assessment of compensation “for a specific category(s) of sites where justified in the public interest”, with reference to the principle “those affected by compulsory purchase should be entitled to fair compensation for their interest rather than receiving elevated values for hope value where development is delivering benefits in the public interest”.

The density and breadth of these planning and related devolution reforms and the alacrity of their progression reflects the contribution that the government expects (and needs) them to make to its wider economic and housing delivery objectives.

That the December 2024 final NPPF included several changes to the July 2024 consulted version reflected both this policy activism and some related ‘learning on the job’, also suggests some uncertainty within government as to how best to operationalise such objectives (see section two).

This panoraks blog, written by an experienced leading planning lawyer provides a clear and informed headline summary of these changes and their implications,  but to provide background reference to non-planning specialists and to provide policy context to sections two and three of this post, some of the key changes are now highlighted and discussed in more detail below.

Introduction of new Standard Method

The standard method (SM) is the methodology that since 2018 has identified a minimum annual local housing need (LHN) figure for each Local Planning Authority (LPA) that can then be aggregated into a national total or target.

According to the most recent relevant MHCLG practice note, it “ensures that plan-making is informed by an unconstrained assessment of the number of homes needed in an area”.

Each LPA is required to plan for the local housing need (LHN) figure that the SM generates for its area as well as for any needs that cannot be met with neighbouring areas.

In turn, the local housing requirement is the minimum number of homes that each LPA seeks to provide during its plan period, based on an assessment of local capacity to do so.

LPAs are only allowed to set a lower housing requirement than its SM figure where they can demonstrate that ‘hard’ local constraints on land and delivery exist, such as across existing National Park or Landscape Areas, protected habitats and flood risk areas, justified also by “other evidence on land availability, constraints on development and any other relevant matters”. 

Such exceptions will need to be justified by LPAs, as now, through its Local Plan (LP) consultation and then the examination process.

Within that process they will then need to demonstrate that they have taken all possible steps to:

  • optimise density;
  • share need with neighbouring authorities; and to,
  • review green belt boundaries.

The new SM that became operative with the December 2024 NPPF ended the previous reliance on decade-old population projections and removed the 35 percent ‘urban uplift’ imposed in December 2023.

Instead, to provide greater predictability the new SM now sets a baseline set at 0.8% of LPA existing stock, adjusted upwards, where applicable, by an affordability multiplier; further strengthened in the wake of the July consultation, according to the response, to focus “additional growth on those places facing the biggest affordability challenges”.

Other changes made to the July consulted NPPF SM version and made operative in the final December 2024 NPPF also involved some reapportionment of LHNs at the margin back towards London (whose target was increased to nearly 88,000 from the 80,700 set by the July consultation method, compared to c99,000 under the previous version) and away the southeast away from the midlands and the north.

Table 1 (SM) reports, by region, the updated LHN figures generated by the new SM relative to both the operative December 2023 and proposed July 2024 consultation versions.

It shows that the changes made (comparative to December 2023 NPPF) to the SM by the new government has increased the total or aggregated annual national dwelling target from around 305,000 to 370,000 dwellings – an increase of 21.4%.

All regions, save London, based on their LHN assessment under the new SM, face substantially increased annual housing targets based on their currently published annual LHNs, with the biggest percentage increases applying to the northern regions.

But the translation of LHNs – in effect, housing targets that provide the denominator for Housing Delivery Test purposes that can determine whether an LPA becomes subject to the presumption to development tilted balance (see dedicated sub-section below for explanation)  –  into actual supply delivery is uncertain and moot: although their increase is necessary and potentially significant, higher LHN figures by themselves unlikely to prove transformative on delivery outcomes (see further discussion on their design and impact in section two).

Transitional arrangements for plan-making

Changes include:

  • The operative date for the new NPPF to take effect for plan-making is delayed to 12 March 2025, save where the exception circumstances set out in the transitional arrangements (see flow diagram in Savills link below)apply;
  • where plans at regulation 19 stage offer a draft housing requirement less than 80% of the local housing need as assessed by the new SM, requiring them to be revised to reflect the requirements of the new NPPF, the deadline for the revised submission of such plans is extended to 12 June 2026 orto12 December 2026, if a refreshed reg. 18 consultation consequently becomes necessary;
  • all earlier stage plans that are now required to progress under the new NPFF will be expected to be submitted for examination no later than 12 December 2026.

A Savills blog advises that the now extended transitional arrangements could mean that by the end of the current parliament, around 25% of LPAs have in place up-to-date plans that remain based on older versions than the new December 2024 SM – a figure that “could increase if LPAs try to rush through plans with lower targets over the next couple of months” (January and February 2025).

Such an outcome would cause aggregated local targets to undershoot 370,000 dwellings and, consequently, put into doubt, according to Savills, whether 300,000 annual delivery could be achieved on the back of the new SM by 2029 (leaving aside other considerations, discussed in section two: in short, even if LP housing targets did aggregate annually to 370,000 that fact alone would not necessarily translate into 300,000 annual new supply). 

Some of the two thirds of LPAs currently without an up-to-date local plan (LP) may also remain resistant to ‘knuckling down’ to producing a new LP in line with new SM, even within the extended transitional timescale periods.

The presumption in favour of sustainable development (presumption), including the maintenance of a deliverable five-year housing land supply (5YHLS)

In truth, direct changes made by the new NPPF to the presumption were largely limited to reversing those made by the previous government under Michael Gove as made operative in the December 2023 NPPF.

Their future significance will likely rest on the combined effect of a slightly strengthened and more certain presumption with the new SM and other planning reforms, most notably the changed treatment of GB land, including the introduction of the concept of grey belt land (see later sub-section for dedicated discussion on that)

In that light, for plan-making purposes, para 11b states that “strategic policies should, as a minimum, provide for objectively assessed needs for housing and other uses, as well as any needs that cannot be met within neighbouring areas”, unless:

(i) the application of policies in this (NPPF) that protect areas or assets of particular importance (as defined in footnote seven, including National Parks and Landscape areas, Heritage Coast, other heritage assets, Green Belt and Local Green Space, as well as areas prone to flooding or coastal erosion) provides a strong reason for restricting the overall scale, type or distribution of development in the plan area; or,

(ii) the adverse impacts of the proposed development would “significantly and demonstrably” outweigh its benefits, when assessed against the policies of the NPPF “taken as a whole”.

The previous presumption set out in paragraph 11(d) of pre-2024 iterations of the NPPF already ‘tilted the balance’ (tilted balance) towards decision-making approval where either:

  • an LPA with an adopted plan was either unable to demonstrate a 5YHLS (save under the December 2023 NPPF version a four-year supply was allowable in certain circumstances with other changes at the margin tending to chip away at the presumption); or,
  • it underdelivered 75% of its housing requirement over the latest three-year period,- as measured by the Housing Delivery Test (HDT).

Outside those circumstances, although the new NPPF retains previous wording pertaining to the policies deemed most important for determining that balance – referring to the “location and design of development and securing affordable homes” –   footnote nine (reproduced later) it now specifically cross-references them to chapter paragraph references across the document.

Para 78 requires LPAs to identify and update annually a supply of specific deliverable sites sufficient to provide a minimum of five years’ worth of housing against their housing requirement set out in their adopted strategic policies, or against their local housing need (LHN) figure where such strategic policies are more than five years old.

That 5YLHS requirement to “ensure choice and competition in the market for land” continues to be attached with an additional five per cent buffer (para 78a).

LPAs that have significantly under delivered housing over the previous three years will become subject to an enhanced 20% rather than 5% buffer requirement (para 78b, now shorn of the qualifications that the previous government’s December 2023 version introduced, most notably pertaining to LPAs with an up-to-date plan less than five years old (para 76 of December 2023 NPPF).

And, from 1 July 2026, for the purposes of decision-making only, the buffer requirement of 20% will apply to LPAs also with a local housing requirement examined and adopted in the last five years against a previous version of the NPPF.

It will apply where its annual average housing requirement is 80% or less of the most up to date local housing need figure calculated using the SM set out in national planning practice guidance prevailing at the time (para 78c).

Such LPAs to avoid the presumption and tilted balance applying to speculative applications, in effect, will then need to demonstrate a six-year housing land supply from 2026.

This a change that could well result in some LPs adopted under the transitional arrangements then becoming subject to the presumption and tilted balance, forcing them to start a fresh LP process under current NPPF rules.

On top of that, and in any case, para 232 of the new NPPF now states:

“However, existing policies should not be considered out-of-date simply because they were adopted or made prior to the publication of this (NPPF). Due weight should be given to them, according to their degree of consistency with this Framework (the closer the policies in the plan to the policies in the Framework, the greater the weight that may be given).

Where a local planning authority can demonstrate a five year supply of deliverable housing sites (with the appropriate buffer as set out in paragraph 78) and where the Housing Delivery Test indicates that the delivery of housing is more than 75% of the housing requirement over the previous three years, policies should not be regarded as out-of-date on the basis that the most up to date local housing need figure (calculated using the standard method set out in planning practice guidance) is greater than the housing requirement set out in adopted strategic policies, for a period of five years from the date of the plan’s adoption”.

The italicised and bolded (by the author) addition to that paragraph, seems to imply that LPA policies could or should be deemed “out of date” five years from post adoption – so activating the “presumption” policy at para 11(d), even where there is no substantial provision shortfall as measured by the 75% HDT test, where its local plan requirement is lower than the SM generated local housing need figure then applicable (para 78 also applies).

Across LPAs generally, where 75% (or less) under-delivery of housing has occurred, again as measured against the latest HDT, the revised presumption (as set out in para 11(d) and footnote eight) will become operative, in addition to an action plan and the 20% buffer requirement.

The presumption will apply in such circumstances regardless of whether an LPA can demonstrate the existence of a rolling 5YLHS or not.

In summary, the revised ‘tilted balance’ now set out in para 11 now reads as follows in relation to decision-making (application determination):

(c)       approving development proposals that accord with an up-to-date development plan without delay; or

(d)       where there are no relevant development plan policies, or the policies which are most important for determining the application are out-of-date (reference to footnote eight), granting permission unless:

  • the application of policies in this Framework that protect areas or assets of particular importance provides a strong (instead of the previous, “clear”) reason for refusing the development proposed; or
  • any adverse impacts of doing so would significantly and demonstrably outweigh the benefits, when assessed against the policies in this Framework taken as a whole, having particular regard to key policies for directing development to sustainable locations, making effective use of land, securing well-designed places and providing affordable homes, individually or in combination (reference to footnote nine that provides cross reference to applicable chapter references).

For sake of completeness, footnote eight reads thus: This includes, for applications involving the provision of housing, situations where: the local planning authority cannot demonstrate a five year supply of deliverable housing sites (with the appropriate buffer as set out in paragraph 78); or where the Housing Delivery Test indicates that the delivery of housing was substantially below (less than 75% of) the housing requirement over the previous three years.

And footnote nine: The policies referred to are those in paragraphs 66 and 84 of chapter five; 91 of chapter seven; 110 and 115 of chapter 9; 129 of chapter 11; and 135 and 139 of chapter 12”.

The latest Housing Delivery Test (HDT) results, measuring delivery against local need (as measured by the old SM for three years to 2022-23) were published on the 12 December 2024 with the new NPPF.

Around seventy LPAs following its publication then became subject to the tilted balance because they delivered less than 75% of their assessed housing during the previous three years.

Interpretation of the ‘tilted balance’, beyond the circumstances discussed above, that render LPA policies automatically out of date, is likely, however, to remain subject to interpretive appeals to the planning inspectorate, as well as subsequent litigation concerning, for instance, whether existing LPA policies are ‘relevant’ to a decision determination or whether, indeed, they are ‘out-of-date’.

Decision-making uncertainty is likely to continue despite or even because of the changes concerning the coverage of the presumption discussed above, and could compound and become more prevalent, especially with respect to GB land, as discussed below.

Affordable housing provision

Para 63 of the new NPPF confirmed that planning policies should reflect the size, the type, and the tenure of housing needed for different groups in the community.

It also made new explicit reference to households needing Social Rent and looked after children, in addition to (but not limited to) existing categories:

  • families with children;
  • older people (including those who require retirement housing, housing-with-care and care homes);
  • students;
  • people with disabilities;
  • service families;
  • travelers;
  • people who rent their homes; and,
  • people wishing to commission or build their own homes.

Para 64 went on to confirm that where a need for affordable housing is identified, LPA planning policies should specify the type of affordable housing required (now revised, as above, to specifically include the minimum proportion of Social Rent homes required), noting that unrevised para 35 requires plans toset out the contributions expected from development, including the physical (transport and sewerage etc) and social infrastructure (educational and health facilities etc)  and types of affordable housing required.

It clearly sets out clearly that such policies should not undermine the deliverability of the plan. Indeed, government practice notes or guidance expects the viability of plan affordable housing requirements (AHO) to be assessed at plan-making and not at an individual project level, even though market and other conditions may change over the plan period (see section three).

Para 66 replaces the previous 10% affordable home ownership requirement with a more general one for major developments involving the provision of housing, where the mix of affordable housing specified or required meets identified local needs across both affordable housing for rent and affordable home ownership tenures.

Para 71 further confirmed that mixed tenure sites providing a mixture of ownership and rental tenures, including Social Rent, other rented affordable housing and build to rent, as well as housing designed for specific groups such as older people’s housing and student accommodation, and plots sold for custom or self-build, should be supported by LPAs through their policies and decisions,  because “they can provide a range of benefits, including creating diverse communities and supporting timely build out rates”.

It did, however, add a rider that this should not preclude schemes “that are mainly, or entirely, for Social Rent or other affordable housing tenures from being supported”.

Intervening paragraphs introduced substantive new ‘golden rules’ applicable to major developments on GB land. These may or may not prove enduring (as later sections discuss).

Para 67 concerning plan-making for major development(s) involving the provision of housing, either on land which is proposed to be released from the Green Belt or which may be permitted on land within the Green Belt”, now requires, “specific affordable housing requirement(s) to be set”.

These should:

 a) be set at a higher level than that which would otherwise apply to land which is not within or proposed to be released from the Green Belt; and

 b) require at least 50% of the housing to be affordable, unless this would make the development of these sites unviable (when tested in accordance with national planning practice guidance on viability).

Para 68 goes on to state such requirements may be set as a single rate or be set at differential rates, subject to the criteria above.

This change should be read and understood in tandem with new paras 156-157 within the dedicated new NPPF chapter on Green Belt land, to which we now turn.

Green and Grey Belt development

180 LPAs include Green Belt (GB) land, which, according to Lichfields, has grown in size by 56% since 1979, and now covers around 12.6% of England’s mass. It has been accorded significant protection from development.

The (unrevised) opening paragraph of new NPPF chapter 13 titled “Protecting the Green Belt” sets the scene clearly:

“The fundamental aim of Green Belt (GB) policy remains is to prevent urban sprawl by keeping land permanently open; the essential characteristics of Green Belts are their openness and their permanence (para 142)”.

The next paragraph (para143) goes on to define five established GB purposes:

  • to check the unrestricted sprawl of large built-up areas;
  • to prevent neighbouring towns merging into one another;
  • to assist in safeguarding the countryside from encroachment;
  • to preserve the setting and special character of historic towns; and,
  • to assist in urban regeneration, by encouraging the recycling of derelict and other urban land.

Existing wording that only allows LPAs to alter their GB boundaries in “exceptional’ circumstances remains also unchanged.

However, the new NPPF then goes on to change much concerning the interpretation and application of precisely what is “exceptional”, what is “inappropriate development” and what are “very special circumstances”, with respect to both the future LPA review of GB boundaries (plan-making) and their determination of applications (decision-making), save for some differences noted below.

In relation to plan-making, para 146 now reads, as follows:

“Exceptional circumstances in this context include, but are not limited to, instances where an authority cannot meet its identified need for homes, commercial or other development through other means.

If that is the case (underlining in this para, added by post author), authorities should review Green Belt boundaries in accordance with the policies in this Framework and propose alterations to meet these needs in full, unless the review provides clear evidence that doing so would fundamentally undermine the purposes (taken together) of the remaining Green Belt, when considered across the area of the plan”

Para 148 goes on to advise that where, in accordance with above, it is necessary to release GB land for development, plans should give priority to previously developed land, then consider grey belt not previously developed, and then to other GB locations.

What is meant by ‘grey belt’ land? The glossary in the new NPFF defines it – both for the purposes of plan-making and decision-making – as:

“ land in the GB comprising previously developed land and/or any other land that, in either case, does not strongly contribute to any of the purposes (a), (b), or (d) set out in para 143, and is otherwise not subject to footnote seven covering National Parks, National Landscape areas and other heritage assets and some other limited categories of land”.

It follows that future LP GB reviews, when required, will need to cover the associated release of grey belt land (now under the new NPPF definition above, to all apparent intents and purposes GB land generally) that do not make a “strong” contribution (outside footnote seven areas) to any of the three below (of the five) defined green belt (GB) purposes:

  • protecting against sprawl;
  • preventing the merging of settlements, and,
  • preserving the setting of historic towns (but no longer, safeguarding from encroachment on countryside).

Concerning the footnote seven areas, NPPF policy regarding those assets and areas will have to be applied to the proposal in question, according to a January 2025 Lichfields briefing note to determine whether a site is grey belt or not and then whether a proposed development satisfies such specific policies.

LPAs, when conducting these reviews, will need to adopt what the government response to the July consultation in December 2024 called a ‘sequential approach’ but as touched on above, now seems more blurred in the new NPPF, considering for release, first:

  •  brownfield land; then,
  • grey belt land; and finally,
  • higher performing GB land; but with regard throughout
  • to the development sustainability – especially regarding the access to transport considerations that paras 110 and 115 set out – of any land proposed for release.

In that light, para 110 states that “significant development should be focused on locations which are or can be made sustainable, through limiting the need to travel and offering a genuine choice of transport modes”.

The overarching sustainability requirement, as explained in the consultation response, at least, will mean that “more sustainable sites on higher performing Green Belt land (for example around train stations) can be brought forward without all Previously Developed Land (PDL) and grey belt opportunities having to be exhausted first”.

All in all, an ambiguous formulation, which further government guidance on the review process and the identification of grey belt land, which was expected in January 2025, may shed more light and clarity on when released.  

With respect to decision-making, unrevised NPPF paras 149 and 150 continue to state that:

“Inappropriate development is, by definition, harmful to the Green Belt and should not be approved except in very special circumstances, but (these) will not exist unless the potential harm to the Green Belt by reason of inappropriateness, and any other harm resulting from the proposal, is clearly outweighed by other considerations”.

New para 155 then, however, goes to state that:

“housing, commercial and other development in the Green Belt should not be regarded as inappropriate where:

a. The development would utilise grey belt land and would not fundamentally   undermine the purposes (taken together) of the remaining Green Belt across the area of the plan;

b. There is a demonstrable unmet need for the type of development proposed, (which footnote 59, echoing footnote eight, defines in the case of applications involving the provisionof housingas the:  lack of a five year supply of deliverable housing sites, including the relevant buffer where applicable, or where the Housing Delivery Tests was below 75% of the housing requirement over the previous three years);

c. The development would be in a sustainable location, with particular reference to paragraphs 110 and 115 of this Framework (access to transport).

d. Where applicable the development proposed meets the ‘Golden Rules’ requirements set out in paragraphs 156-157 below.

A Lichfields flow chart provides a useful diagrammatic summary. In short, the tilted balance of the presumption to development will come into play with respect to speculative applications made by developers concerning the development of grey belt land on GB land located within LPAs whose plans are out of date according to para 155(b) reproduced above.

That is a big and potentially transformative change that could cover most LPAs with GB land, at least in the short term.

However, any such speculative applications will need to conform with the ‘golden rules’ that the July 2024 NPPF introduced, as modified by new NPPF para 156, which states:

“Where major development involving the provision of housing is proposed on land released from the Green Belt through plan preparation or review, or on sites in the Green Belt subject to a planning application, the following contributions (‘Golden Rules’) should be made:

 a. affordable housing which reflects either: (i) development plan policies produced in accordance with paragraphs 67-68 of this Framework; or (ii) until such policies are in place, the policy set out in paragraph 157 below;

 b. necessary improvements to local or national infrastructure; and,

 c. the provision of new, or improvements to existing, green spaces that are accessible to the public. New residents should be able to access good quality green spaces within a short walk of their home, whether through onsite provision or through access to offsite spaces.

New para 157, concerning decision-making, morphs the July 50% affordable housing target into a more flexible “policy plus” one, which, according to the response, should better reflect regional and other site locational variations, so helping “to balance ambitious affordable housing targets with viability challenges”.

It is now set at 15% above that of the relevant existing local affordable housing target, subject to a cap of 50%; where no pre-existing target exists, that cap will apply by default.

This revised para 157 also links GB development site-specific viability reviews to “e subject to the approach set out in national planning practice guidance on viability., which in February 2025 remained subject to a MHCLG review (see Section three for the background to this involving the setting of benchmark land values (BLVs) and its possible significance).

The new NPPF in next para 158 then goes on to give more power to the golden rules decision-making elbow:

 “A proposed development which complies with the Golden Rules should be given significant weight in favour of the grant of permission”.

This is regardless of whether it is sited on grey or higher quality green belt land, especially relevant if subject to application approval and covered by the ‘tilted balance’ presumption widened as above for GB land.

Taken together, these changes could potentially lead to a significant increase in housebuilding on GB land.

They represent probably the most significant, along with the new SM (perhaps, more so, depending on future outcomes) of the December 2024-related changes.

Early estimates of the additional housing that as a result could be provided, range from a pessimistic 50,000 (including sceptical volume housebuilders alleging that the ‘golden rules’ will render their private speculative-led developments unviable) to an eye watering and frankly unrealistic four million suggested by land agents gearing up to offer their services to developers wishing to utilise the changes. Somewhere in the 000’s seems a more likely ballpark, but time will tell.

That is because the operative word, of course, is potential.

Plan-making will stretch well into the future beyond the lifetime of this parliament. GB land release is likely to be both contentious and contestable, subject to conflicting interpretations that can be expected to translate into planning appeals and litigation. It is also likely to prove highly political at both local and central levels.

All these uncertainties was played out in real time in the January 2025 PI Examination of the London Borough of Enfield’s LP.

This which proposed developments on local GB land that had been previously opposed by the Mayor of London because the council had not yet exhausted existing local brownfield development opportunities.

But, as explained here  and here, his representative at the Examination, speaking with the delegated authority of the Mayor, conceded that to meet London’s housing requirement as uplifted by the new SM, that some GB development would be necessary because brownfield development would be insufficient.

A sting in the tail followed: the GLA submitted further indicative evidence that alternative local GB sites closer and better integrated with existing transport nodes and networks (basically Cockfosters and Oakwood underground stations) could potentially provide more housing and prove more sustainable, in accord both with London Plan and new NPPF requirements,“on the basis of building sustainable, liveable neighbourhoods with access to public and active transport options, making the best use of land”.

That change in tack was to the apparent chagrin of developers, including Berkeley, involved with Enfield’s current proposals, which, apparently have been doing the rounds for years, as well as those opposed to the principle of local GB development, full stop.

A lot remains to play out and sort out, then, especially as Sir Sadiq Khan seems a reluctant convert and soldier to GB land release, who could well still drag his feet, although his point that such development should maximise benefit and “bang for their bucks” is salient.

Something to monitor in policy and political terms, rather than watch spades being put in the ground for some time yet.

Speculative applications on GB land subject to the golden rules set out above could also conflict with the intrinsic drivers of the current private speculative housing model to dribble out new supply to maintain required price and profit levels.

Certainly, any prospect of any step change in supply delivery propelled by completed private-led developments on newly released GB land, as well as elsewhere, during this parliament at least, is uncertain.

That said, this little drama does show that planning reform in general and the new NPPF in particular, notwithstanding the claims of some nay-sayers, can or could potentially make a real difference to, and act as a real driver of, supply but as the next section explains, incompletely and partially at best without wider changes.

2          Planning reform, necessary but not sufficient

The first post of this series delving into government’s 1.5m housing delivery target, its definition and measurement, its phasing and prospects of achievement, and its relationship to existing public and private delivery systems, showed why this ambition, target, commitment, or whatever – even if it could be measured precisely and accurately by the end of 2029 – will almost certainly not be met, barring unforeseen and fortuitous changes in the economic, institutional, and policy environment.

In short, to compensate for the substantial sub-300,000 annual delivery backlog that undoubtedly will have accumulated by April 2027, little or no reason exists at present to suppose that a 370,000 annual new dwelling supply can be sustained during the remaining 2027-29 years of this current parliament.

Planning reform by itself will not deliver it or, indeed, any sustained step-change in housing supply. Leaving aside the issues that section one discussed concerning the impact of the new NPPF’s LP transitional arrangements on delivery, the revised and uplifted LHN figures (broadly speaking, their LP plan targets) produced by the new SM aggregate to around 370,000 dwellings per annum.

Planning targets based on bureaucratically assessed housing needs, however, will not translate directly nor necessarily into an increased volume of planning permissions that are then converted into subsequent and commensurate start and completion levels. 

Only a proportion of planning permissions (note the word, permissions) are delivered as completions. And then only after an uncertain time lag, which on larger sites can extend into a decade or more.

Private speculative newly built housing provided (pre-planning, land acquired, assembled, serviced, and built with the necessary permissions) for profit without a known buyer or certain end price for sale, accounts generally for between 65% and 75% total annual new build completions in England.

Historically, the last time annual private speculative market supply touched 180,000 dwellings was at the peak of the late Thatcherite ‘Lawson boom’ in 1988 fleetingly, before it imploded into bust. Around 170,000 new build private dwellings were completed during the latest 2019-20 peak year.

The future volume of planning applications, and even more so their translation and delivery into homes, largely depend upon three factors or parameters that operate outside the planning system:

  1. The expected or perceived direction and state of the national economy;
  2. The drivers of the private speculative business plan model, largely predicated on maximizing profit margin rather than volume delivery;
  3. The availability of public funding to support new affordable housing provision, most of which under current arrangements comprise front-loaded grant, counting against public borrowing and debt, and subject to the new government’s new fiscal framework.

With respect to (1), peering into the future, even if the macro-economy performs in accordance with October 2024 Office of Budget Responsibility (OBR) forecasts – a prospect that at the time of writing appears optimistic  (Bank of England on 6th February downgraded its 2025 growth forecast to 0.75% – private completions will struggle within existing private speculative model constraints to reach or exceed such past peak levels.

With respect to (2), in a nutshell, reliance on the existing private speculative model will not do anything in the absence of other systemic changes, to encourage, induce, or force developers to build both more and quicker in contrast to dribbling out supply in accordance with their business plan imperatives. For larger schemes that could mean over decades, rather than across the short- or even medium-term, with supply delivery composition tilted towards higher value homes.

With respect to (3), for annual supply by the end of this parliament to have any chance of reaching even a more feasible, yet still momentous and still very challenging 300,000 dwellings, between 100,000-140,000-plus public-enabled or funded affordable dwellings would have to be provided annually by 2027-29.

Its achievement would require higher levels of public grant unlikely to be consistent with the new government’s fiscal rule framework, which, while allowing borrowing for investment, also requires debt as a proportion of gdp (gross domestic product) to be falling by the end of a five-year rolling forecast period (to be shortened to three), as verified by the Office of Budget Responsibility (OBR).

Although we await the 2025 Comprehensive Spending Review (CSR that will set spending limits for 2026-29), the prospect of it funding such a future programme seems unpromising to say the least, especially if most of the dwellings funded are of SR sub tenure, which across the high cost need areas – where they are most needed – are most expensive in unit grant amounts. Such a programme could claim an annual programme funding uplift of up to £16bn.

In any case, local authorities and housing associations currently lack the capacity to scale up delivery to that level, and any increased funding would have to be scaled up and backloaded to later years.

Due to development time lags, completions would not occur, in the main, until after 2029 – at least if they were new builds; although funding in the short-term could be tilted towards acquisition as part of an emergency more immediate response to the homelessness crisis.  

A new generation of New Towns is unlikely to come on stream substantively until the next decade.

Otherwise, and notwithstanding or despite the devolution agenda (which could prove disruptive and distracting), development gestation and time lags requires the government within the next two years to work together systematically with Mayoral, combined authorities and newly created bespoke urban or other development corporations, for other new large plans/projects to have any chance of them producing spades in the ground by mid-2029.

A sustained future 300,000 dwelling annual delivery, therefore, requires measures, initiatives and changes, supplemental to planning reform, to both public and private delivery systems and their interaction (as section three outlines).

Strengthened presumption of development v primacy of plan making, including on GB land

As section one explained, LHNs or local housing targets assessed by the new SM will provide the denominator against which local delivery is measured against for HDT purposes.

Consequently, more LPAs will be pushed into the presumption and tilted balance, while the new NPPF will also extend its coverage and application, especially on GB land.

A paradox thus emerges: a government aiming to accelerate and bring to fruition a plan-led system, when currently only a third of LPAs have one, is having to use the prod of an extended presumption to development that, in turn, will encourage speculative applications outside such a system.

Although that – given the recent history and the tendency for Nimbyism to derail planning reforms or changes geared to increasing housing supply – is something that may well both be inevitable and necessary, it will mean, across the short term, at least, and quite likely for much, if not the entire lifetime of this parliament, that the government will have to heavily rely on speculative non-LP compliant applications translating into starts and completions quickly enough to provide most of the new supply delivery target.

A consequent tension is thus discernible between using the presumption to secure increased supply within the timescales required by the government’s delivery target and the purposes and paramountcy of a plan-led system.

Another example: In its response to the July NPPF consultation, the government set out its position on how grey belt policy relates to the development plan: “We fully support a plan-led system. However, we believe that it is necessary to allow development on suitable grey belt land through decision making (in line with relevant triggers), in order to address the housing crisis and ensure other development needs are met”.

Other changes are afoot to that system. MHCLG’s  Brownfield passport working paper suggests that the government wants to shift towards a centrally mandated zonal permissive system and away from a locally discretionary one, not unlike what the 2020 Planning White Paper proposed (see here for further detail and discussion on that) – for the time being, in the first instance, in relation to the brownfield land.

Proposing options ‘brownfield passports’, which would make “the default answer to suitable proposals being a straightforward “yes”…which would mean being explicit that development on brownfield land within urban settlements is acceptable unless specified exclusions apply”, the paper also suggested setting national policy setting minimum expectations for certain types of location where a particular scale of development may be appropriate, for example, development should be of at least four storeys fronting principal streets in settlements with a high level of accessibility, and/or set acceptable density ranges amenable to suitable forms of intensification or ‘upzoning’.

Alternatively, local planning could be amended to encourage such parameters to be set through local development plans articulated through design codes for appropriate locations – whether across whole urban areas or at a more local scale.

In a 26 January newsrelease, the chancellor, herself, seemed to confirm that the government will ensure that when developers submit an application for acceptable types of schemes in key areas – such as in high potential locations near commuter transport hubs – that the default answer to development is ‘yes’ to “unlock more housing at a greater density in areas central to local communities, boosting the government’s number one mission to grow the economy”.

Such media releases, however, as ever, should put into actual policy and delivery context, para 125(c) (unrevised by new NPPF) continues to state:

“Planning policies and decisions should […] give substantial weight to the value of using suitable brownfield land within settlements for homes and other identified needs, proposals for which should be approved unless substantial harm would be caused”.

It is not precisely clear what such passports would entail over and above that requirement, nor what competing weights, such that, for instance, should be accorded to applicant adherence to local affordable and other planning requirements.

Limitations of the SM

Although the latest shift to a stock-based SM combined with a stronger affordability multiplier, might produce needed higher LP housing targets, the previous section explained why it and they will not, by themselves, translate into higher starts and completions any time soon.

The SM methodology, even as revised, also possesses wider design limitations. It, like previous versions, is a mechanistic exercise that produces LHN figures, not necessarily related to the type, tenure, and affordability of dwellings locally needed.

As Table One indicated it could skew future planning-led activity away from the areas with the highest need demand pressures. Areas with high historic stock levels (noting the new SM is calibrated to existing stock levels) can also have a surplus of poor-quality housing, rather than a shortage of housing, per se.

Although an increased housing supply across such lower need areas could still offer better choice and opportunity at a local level and thus contribute to ‘levelling-up objectives’, the economic benefit of additional housing in such locations may well be less than could be generated across higher need and demand areas, where these add most to economic value added per capita.

Accordingly, a competing case exists for concentrating housing supply across areas where the most agglomerative and other external economic benefits can be reaped, such as the Oxford and Cambridge growth corridor. The SM affordability multiplier remains a very blunt and imperfect mechanism for that purpose.

The posited advantage of greater predictability accorded to the new SM seems to be belied by its short-term results, at least in Greater London.

Table 2 reports significant swings, even gyrations, in the LHN figure it generates compared to the previous method. East London boroughs, Tower Hamlets, Barking and Dagenham, and Newham now have annual targets around 50% less than under the old method, while outer borough, Bromley faces a target that has increased by over 100%.

True, the SM is not designed to reflect local capacity and deliverability considerations, which could be and usefully given more weight in the setting of future local plan housing requirements, but that is a long term process, rendered more uncertain by the priority accorded by the new government nationally to spatial planning on a larger geographical scale – arrangements that will take the lifetime of this parliament to bed-in.

A similar point would seem to apply to the incorporation of the duty to co-operate into future local plan housing requirements.

According to the Devolution White Paper (Box A), strategic authorities will be required to apportion the SM-determined cumulative LHNs of the constituent members between them.

The apportioned figure set for each constituent member comprising the SDS (again on the model of the London Plan – which acts as the SDS for the capital) will then become each member’s minimum housing requirement for the purposes of their next Local Plan.

Agreement on the precise distribution of housing need/local housing requirements will thus be agreed through the SDS development process.

Future arrangements for agreeing a SDS in areas without a Strategic Authority are expected to follow the same principles as Foundation Strategic Authorities (see section one).

All well and good, but the fundamental fact remains that in the crucial case of London, which as noted above has had an SDS for some time, delivery has continued to substantially undershoot the total of still prevailing SDS-set local plan requirements.

These themselves were lower than the total of constituent member LHNs; although London’s total target SM target at c87,000 is now lower than the previous c98,000, annual supply delivery will still need to rise nearly threefold by 2029 for the aggregate London-wide LHN target to be reached.

Although that seems moonshine, if London under performs, it cannot be reasonably expected, as above, that other regions will compensate by over-supply, especially given across the board target increases. Something will have to give (see section three)

A timeworn cynic might, unhelpfully, add that by then it will probably be time to change the method again.

Policy certainty v needed flexibility in relation to affordable housing obligations (AHOs)

As section two recorded, the December 2024 NPPF adjusted the 50% AHO golden rule, introduced in the July consulted version for decision making purposes, to a 15% premium on top of existing affordable housing requirements, up to a maximum of 50%.

That change, according to the consultation response, was driven by expressed concerns that a nationally set uniform requirement at 50% would fail to reflect regional variations in viability, hence hindering delivery.

The issue possesses wider resonance: in London some public as well as private stakeholders have cautioned that requiring over onerous AHOs in current market conditions, marked by interest rate uncertainty and heightened post-Grenfell building costs, risks getting ‘a percentage of nowt rather than a percentage of something’.

Back in 2023, this website highlighted in The new Infrastructure Levy: Going round the Mulberry Bush, (see its Table 2) a wider bedevilling problem: while, on one hand, a national policy requirement that offers universal certainty and clarity can speed housing provision by giving all actors greater certainty about what is required and what will achieve planning permission; on the other, differing site and regional/area circumstances are not amenable to such a one size fits all approach.

Para 28 of the July NPPF consultation had itself recognised that the developer contributions that can be secured from development will vary between areas, and between individual sites: some areas have lower house prices; some sites will have abnormal costs; and that Community Infrastructure Levy (CIL) rates vary between those local planning authorities which charge it, while some sites may have a higher value in their existing use.

Besides, a standard x% AHO requirement can encompass different permutations of affordable housing, ranging from 100% Social rent (SR) to 100% intermediate and in-between: all involving different cost and value permutations to developers and LPAs.

The government has continued to reiterate that LPAs are best placed to assess and decide that tenure mix at a local level, along with the manifesto pledge to “deliver the biggest increase in social and affordable housebuilding in a generation”.

The local need for SR and other affordable sub tenures varies with region and area. It is, therefore, right that the provision mix should be subject to local discretion with central oversight.

The danger in reducing national policy certainty – at least regarding speculative applications relating to non-plan allocated GB land – is that the purpose and application the NPPF ‘golden rules’ will be undermined.

Development on released GB and other land could consequently swing towards to developer profit maximising and phasing imperatives, not national and local needs.

Another possible issue is a programme dominated by Social Rent (SR), providing 90,000 or so of an overall affordable programme of 120,000 to 140,000-plus dwellings, is not necessarily consistent with tenure diversity and choice, nor mixed communities.

Such a predominance could risk a return to new mono-tenure estates, notwithstanding their documented past problems in some locations and contexts.

It would also require higher public grant subsidy input compared to a more balanced programme during a period of fiscal pressure.

Strong arguments have been made, for example, here, that the distribution of SR has over recent decades has been skewed away from urban areas with the highest concentrated need for such accommodation.

Certainly, in London, Manchester, and other high need areas – SR undoubtedly has been under-provided for decades, culminating in the recent manifestation of peaks in family homelessness, resulting in councils having to resort to costly TA accommodation, which only partially centrally subsidised, has led to budget shortfalls that threaten reportedly to bankrupt some of them.

However, threading back to the public funding issue, such areas also tend to be high-cost areas that are grant-intensive: unit SR grant levels in London can exceed 200K, with 130-150K or more common, considered further below.

3.           Tilting towards a partial public contracting system will take time

The government is on the horns of a dilemma. To achieve its housing delivery target (or as this post shows, even to approach it) it must rely on the current private speculative housing system and the large volume housebuilders, but that model includes intrinsic features that historically have, and will continue to result in endemic supply under-provision, relative to both national economic and social needs, with any peak supply periods characterised by escalating real house prices, worsening current and future affordability.  

Reforming that system will take time, requiring a step-change increase in public investment support of both enabling infrastructure and affordable housing provision within a fiscal environment that is unlikely – given current fiscal rules and institutional arrangements – to provide the resources required.

But escaping the other horn requires us to build more now – a time of economic uncertainty marked by continuing high interest rates, sluggish, if not stagnant, economic and household income growth mired in international political uncertainties, the effects of which have coalesced with a perfect storm of domestic housing supply-side factors, including heightened post-Grenfell regulatory costs and associated delays.  

To take one current manifestation of the dilemma: the new NPPF seems to expect AHOs to do the heavy lifting to ensure that new developments provide more affordable homes, with a particular reference to SR. 

But relying on a strengthened planning obligations system alongside the introduction of ‘golden rules’ on released green and grey belt land is likely to rub against these model constraints, at least during this parliament.

On the other hand, reducing or lifting AHOs more generally in London or elsewhere by itself is unlikely to bring forward developments that have stalled for a variety of reasons, as outlined above.

Less AHO supported units mean a corresponding greater need for directly funded units to replace them at a consequent higher total public expenditure cost, during a period of fiscal stress: lifting the ‘burden’ of AHOs from the private sector at any given level of public grant availability will tend to decrease rather than increase SR supply.

Moreover, relaxing AHOs now could prove – as it did in the wake of the GFC – a thin end of the wedge, where developers later reap the benefit of improving macro-economic and housing market conditions, earning excess profits, encouraging them to bid up land prices and costs again, so further intensifying and entrenching the inherent failures of what Theresa May called Britain’s ‘broken’ system.

Short-term constraints and possible ameliorative fix responses can therefore undermine the realisation of future sustainable long-term reform.

That is true, not only with housing supply, but across the economic and social policy generally.

Tackling hospital waiting lists through targets and short-term measures that do little by themselves to tackle their root causes, including inadequate social care, can also delay and distract from long-term solutions  (see recent Treasury NHS financial sustainability Committee report).

The government must also work in partnership with the private sector, influencing and encouraging, as well as modifying while setting the groove of future reform.

Short-term policy carrots in the form of, say, approvals of schemes made conditional on adherence to required design and affordability requirements within a defined timescales could be fast tracked accompanied with undertakings to undertake a late viability review if required, as per the approach of the December 2024 Accelerating Housing Delivery GLA practice note could be offered.

The 35% campaign in a February 2025 blog on Phase Two of the London Borough of Southwark Aylesbury Estate regeneration, however, raised some evidenced doubts on whether increasing SR grant funding in apparent efforts to improve scheme viability at apparently eye-watering marginal grant cost provides the best way to achieve vfm in terms of overall SR provision

It made the parallel point, in effect, that some profit is better than nowt profit, in the process rather putting the spotlight on the asymmetrical assumption/practice that when conditions treats development profit margins are sacrosanct change but not AHO and other planning obligations.

Also in the short term, making a dent in family homelessness and TA costs is a necessity, making it an apparent no-brainer that has begun to be taken on by government at central and local that available resources should be targeted to such areas for innovative schemes to provide cost effective and more socially suitable alternatives to TA quickly through acquisition, where possible.

Looking ahead longer term and strategically, the second post in the series sketched out a route map to mainstream affordable housing provision across both public and private sectors to maximise supply, quality, and affordability outcomes.

That post and Making the Most of the Budget posts both made the point that it would have been better for the new Chancellor in her October 2024 budget (budget) to make the case for additional public investment clearly, directly and transparently, according to its economic and thus fiscal sustainability merits, rather than tweaking fiscal second order rules, which, when political push comes to shove, inevitably tend to be gamed or changed, arguing that the government’s delivery target as well as its wider growth mission, presuppose and requires:

  • fiscal institutional reform to make public investment planning, selection and delivery more efficient and effective;
  • a shift of public and private housing delivery systems towards a partial public contracting-led partnership model to reduce the current reliance on the existing predominant private speculative provision model – one that is better designed to deliver a sustainable steady state 300,000-plus annual housing supply.

With regard to the former and as way of historical context, Conservative governments in the early nineties tended to rely upon second order objectives, such as the exchange rate, to bear down on inflation, rather than making low and stable inflation an overriding first order objective supported by reformed institutional architecture consistent with its achievement, as New Labour then did to notable success in 1997.

Although the budget did announce some relevant but limited ‘guardrails’ to that end and that, more substantively, the National Infrastructure and Service Transformation Authority (NISTA) – combining the functions of both the existing National Infrastructure Commission and the Infrastructure and Projects Authority – would become operational by spring 2025, when it will become responsible for implementing the government’s infrastructure strategy, validating business cases, prior to HM Treasury funding approval.

It also formally confirmed the establishment of the Office for Value for Money (OVM) with the appointment of an independent Chair, who as a first step, will advise the Chancellor and Chief Secretary to the Treasury on decisions relating to the multi-year spring 2025 comprehensive spending review (2025 CSR).

Although these measures represent potential steps forward, the creation and development of both new bodies should have been and should now and in the future be made central and integral to the government’s overarching growth mission and commitment to economic and fiscal sustainability – not a subsidiary budget add-on – especially as the future effectiveness of both new organisations will depend on their own independent institutional clout and resourcing – a point that the Treasury Committee chair, Meg Hillier, picked up on in January 2025.

Such concerns were only reinforced by the chancellor’s 26 January news release (see previous link) that rather presented the ticking off fast tracked approval of 150 projects, as if such approvals were the key outcome required, rather than achieving their best selection and phasing to maximise their economic and social contribution: another possible example, it seems, of short term gestures trumping sustainable and embedded long term and lasting reform.

The objective and evidence-led assessment of the net economic and social benefit of Social Rent (SR) and other intermediate sub tenure expanded to a level consistent with the future achievement of a sustainable new supply at an annual 300,000 or above dwelling level – compared to doing nothing or to alternative housing system changes  – provides a clear case and immediately pressing example of where both NISTA and the OVM could and should play pivotal and instrumental roles.

A point underscored by the apparently ‘unanswerable’ case advanced by many in the housing world for funding such a sustained and enlarged programme on the strong ground that it would save money over the long term, is likely to cut across Treasury and fiscal rule resistance to its front-loading short term impact on public borrowing and debt.  

In that light, it is unfortunate that neither NISTA nor OVM are likely to be operative in time to comprehensively contribute within the 2025 CSR, even though a stab in that direction potentially could usefully be made.

Otherwise, the prevailing MHCLG policy direction of travel appears possibly consistent with a shift to a partial contracting system, at least across the three inter-linked areas.

First, the introduction of ‘golden rules’ applicable to development on GB land as the new NPPF (paras 68 and 155 and 156) set out (see section one).

Second, setting low benchmark land values (BLVs) for viability purposes – broadly defined as the value that a willing landowner would be prepared to sell their land for a proposed development purpose – to keep land acquisition costs closer to their existing use value (EUV).

Para 157 of the July consulted NPPF version had had offered additional guidance on viability considerations for development in the Green Belt, attaching a cross reference to an Annex 4, which sought to establish, a BLV based on EUV plus a “reasonable and proportionate premium”.

Consultee responders were invited to specify such a value for national policy purposes, with a nudge that it should be closer to three times EUV compared to current industry expectations.

Both that para and Annex four, however, was omitted in the new operative December 2024 version.

Instead, site-specific viability negotiation on GB land was prohibited in a December 2024 update to MHCLG  viability guidance, pending “strengthened national planning practice guidance on viability (which apparently) will consider the case for permitting viability negotiations on previously developed land and larger strategic sites, likely to carry greater infrastructure costs”, which, in February 2025 was awaited.

Third, continuing reform of compulsory purchase order (CPO) rules consistent with the use of CPO as a backup default stick to encourage voluntary exchanges at a defined premium close to existing use values on and beyond GB land, including greenfield, urban extensions, and the next generation of New Towns.

It seems clear to this website that all three are both inter-linked and will be dependent on each other to be effective long-term and should underpin the future development of a partial contracting model.

Certainly, laying the foundations of such a shift will require not only unwavering political commitment, perseverance, and focus but also time and patience, when Its fruits are unlikely to be enjoyed fully until the next decade.

It would both presuppose and assist the next generation of multi-tenure new towns and strategic settlements to come on stream substantively and expeditiously, as well to promote and foster partnership planning between public and private sectors through the mainstreaming of affordable housing across both sectors.

The danger is, however, that the three inter-linked measures are blown off-course by short term industry pressures to push up supply from its current cyclical low amid claims that the ‘golden rules’ will render GB development unviable.

Certainly, as section two noted, mayoral and other development corporations will need to mobilised and enabled, sooner rather than later, to grasp the opportunities accorded by planning reform.  

In that light, this report made the timely the case for a new town in London to lead the way, building upon its natural infrastructural and economic advantages and harnessing existing GLA powers to create mayoral development corporations to further its SDS. As Table 2 highlighted, a massive step change in housing supply is required within the capital for both that and the government’s delivery target to be approached.

For such a project to be progressed, however, the active and sustained backing of both central government and the Mayor of London would be required – perhaps providing a litmus test for the entire planning reform agenda.

Similar possible demonstration or trailblazer projects customised to local conditions and needs could be developed within the Oxford and Cambridge arc and the existing most established directly elected Mayoral authorities, where they are most needed economically and socially both nationally and regionally, and could and must be developed with minimum delay, if the delivery target is not to be reduced to a forlorn aspiration marked by hubris rather active pragmatism.

Certainly, ramping up and facilitating such development corporations to master plan and manage large scale developments offering a range of property types and tenure at different affordability levels on a Letwin-plus model is necessary to bring on stream a transformational step change delivery within ten years.
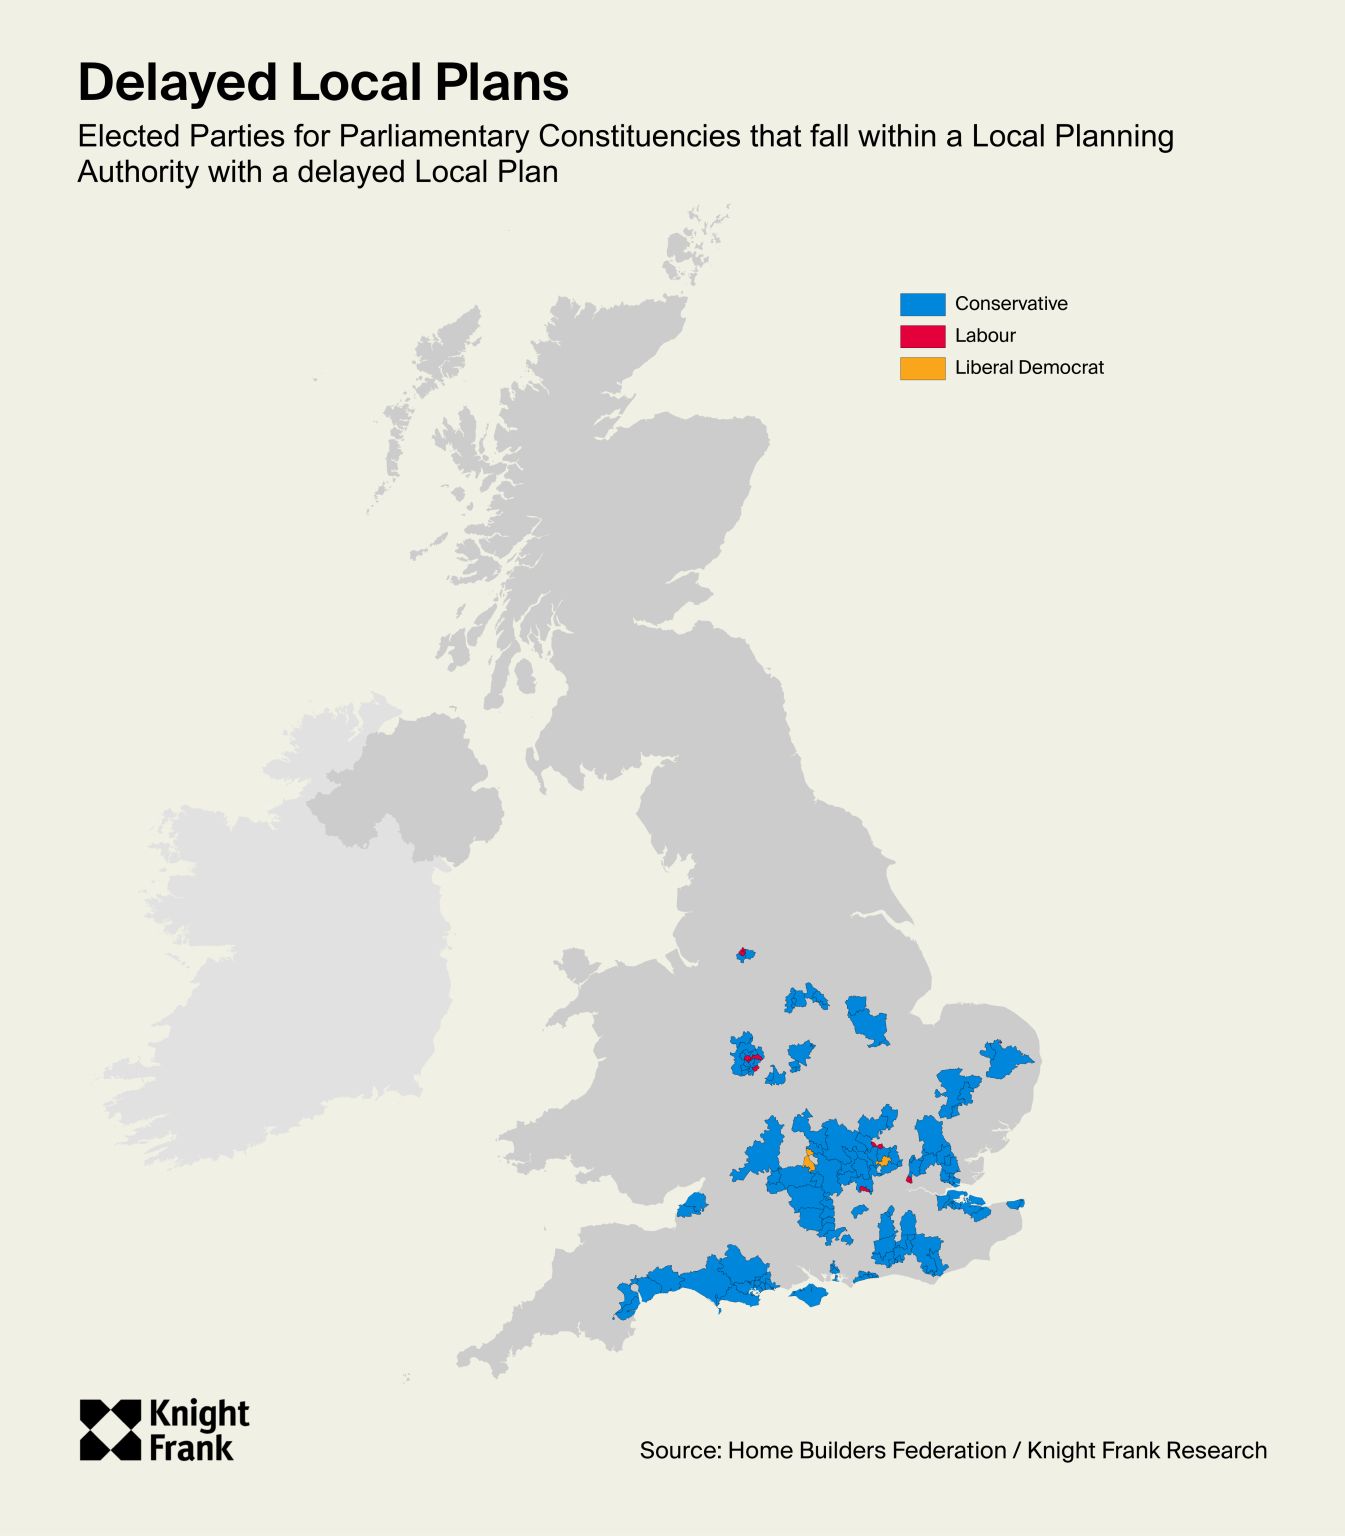
Share this:

  • Click to share on X (Opens in new window) X
  • Click to share on Facebook (Opens in new window) Facebook
  • Click to print (Opens in new window) Print
  • Click to email a link to a friend (Opens in new window) Email
  • Click to share on WhatsApp (Opens in new window) WhatsApp
  • Click to share on LinkedIn (Opens in new window) LinkedIn

Filed Under: Housing Tagged With: fiscal reform, planning reform

Making the Most of the Budget

17th November 2024 by newtjoh

The first Labour budget for 14 years and the first ever delivered by a female chancellor was also momentous in its expected expansionary impact on the economy (net fiscal loosening adding to aggregate demand) notwithstanding that its planned annual tax increases of around £36bn will take the share of tax to GDP to record levels.

This post reflects and focuses on its implications, according to three main headings:  the real crisis of the fiscal state; fiscal institutional reform and public investment planning and delivery (which includes investment in public (social) housing as a case study); and Labour’s 1.5m housing target – scaled down to putting the annual new supply of 300,000 dwellings onto a sustainable footing by the end of this current parliament.

The Autumn Budget 2024 Treasury Red Book (Red Book) and the Office of Budget Responsibility (OBR) October 2024 Economic and Fiscal Outlook  provide its main source documents.

The fourth section, waiting for Mr Growth, notes that although the OBR post-budget assessment and its five-year forecast indicate continuing levels of stunted growth during the lifetime of this 2024-29 parliament, it does not take account of the future policy and economic impacts of the Spring 2025 Comprehensive Spending Review (2025 CSR), or of planning reform, or of the future operation of the National Wealth Fund combined with pension fund reform.

Together they will prove pivotable as to whether the actions of this Starmer government (besides external shocks and events) can and will uplift the annual growth rate towards the 2.5% level more consistent with both a sustainable welfare state and public finances.  

1             The Real Crisis of the Fiscal State

The real crisis of the fiscal state (RCFS) is the mismatch between the public expenditure requirements of the UK (assuming a continuing public desire and demand for accessible and universal public services and goods on the European social democratic model) and the political and electoral willingness for them to be met through forms of taxation that are efficient, sufficient, and transparent.

It means that the dominant political parties promise to reduce or at least not to raise taxes while also claiming that they will improve or at least protect public services that require real (inflation-adjusted) increases due to the increased demands of an aging population, higher relative costs and other related reasons.

Essentially, that is an incompatible combination with the stunted levels of growth that the UK has clocked-up since the Global Financial Recession (GFC) a decade and half ago.

The October 2024 budget (budget) followed an election where the previous Conservative government had within a six-month period twice reduced employee national insurance rates by two per cent, despite knowing that doing so would either require unsustainable future levels of borrowing or unachievable future cuts to already unrealistically low planned spending plans.

Labour when in opposition supported both these cuts (in essence, pre-election bribes) while committing itself in government not to increase headline rates of income tax, national insurance or VAT: its tax self-denying ordinance.

Notwithstanding previous and some continuing protestations to the contrary, the budget will increase taxation substantially on non-affluent working people.

First and foremost, the continuing freeze until April 2029 of income tax thresholds, to all intents and purposes, is a tax increase, chipping away both nominal and real increases in pay, bringing either into tax or into the higher tax bracket millions of extra taxpayers.

It is an expedient and effective but also an invidious, distortive, and stealthier way to raise revenue compared to increasing headline rates, raising around £28bn for the public coffers in 2025-26, rising to nearly £38bn by 2028-29.

Second, the increase in employer’s national insurance contributions (NIC) from 13.8% to 15%, made effective at a lower threshold and without a limitation of a higher threshold, is expected to raise around another £25bn annually from 2025-26 to 2029-30 (static effects not taking account of behavioural responses by economic agents), more than offsetting the £20bn reoccurring annual cost of the previous government’s successive employee NIC cuts (see OBR Table 3.9).

Workers will consequently receive lower wages and/or pension contributions than they would otherwise have done without the NIC increase.  Future real wages will be further dragged down by businesses, where and when they can, levying higher prices rather than lower profits accommodating their resulting higher costs.

Increasing in employee NIC or income tax rates instead would have had a more immediate, direct and thus salient impact on nominal post-tax employee incomes; the employer NIC increase is likely to have a more muted, delayed, and hidden although still real effect over the forecast period. The employer NIC increase is a direct and salient cost for businesses.

Where businesses take the hit of employer NIC increase through lower profits that is potentially redistributive in terms of its relative incidence between capital and labour. The lack of threshold limitation is also possibly redistributive (but less so than a direct increase in the income tax rate) although it could incentivise off-PAYE employment and other distortionary arrangements, reducing its yield.

On the other hand, the increased liability to pay employer NICs at a lower threshold combined with an increased minimum wage is likely to bear down on lower-wage workers through reduced employment effects.

According to the OBR forecast, the combined impact of the continuing tax threshold freeze and the new employer NIC increase (plus some other smaller tax increases) will take the tax take by 2029-30 to a historic high of 38 per cent of GDP, causing private consumption to fall as a share of GDP.

That, along with the short-term squeeze on profit margins occasioned by the employer NIC rise, is expected to further deflate business investment further. Already, its share of GDP is one of the lowest in the industrialised world, representing a core and chronic determinant of the UK’s stunted post GFC growth and productivity record.

On the face of it, therefore, the budget (when its policies are considered in isolation), over the medium term (essentially the five-year OBR forecast period) will not only increase taxes on working people in real outcome terms but will retard future growth: quite contrary, in effect, to the government’s avowed aims.

Labour had to win an election. Its tax self-denying ordinance and limited ambition costed fiscal pledges were made to neutralize Conservative attempts to paint it again as the ‘tax and spend’ party as happened to instructive effect in 1992, 2010, and 2015.

But it also constrained honest public debate on the fiscal situation and future choices concerning that and the state of the public realm, as well as boxing-in Labour’s own future policy maneuverability in government.

In retrospect, the public had realized intuitively that post-election tax increases were inevitable, regardless of the political complexion of the new government, and proceeded to punish successive incumbent Conservative governments for their incompetence, their poor behaviour, and their lack of delivery, while in office.

The second Conservative employee NIC cut, at least, could have been opposed as an obvious unsustainable electoral bribe. The Labour leadership, however, did not want to risk any suggestion that they would reverse any Conservative tax cut and thus increase direct tax rates; hence Labour’s self-denying ordinance and resort to alternative sources of revenue.

In short, the budget, compared to March 2024 budget plans, increased planned public spending by almost £70 billion annually (a little over two per cent of GDP) from 2025-26 to 2029-30,  split two-thirds on current and one-third on capital spending, paid for by increased taxes amounting to £36bn annually, requiring increased average annual borrowing of £32bn,  (see OBR Table 3.1 for more precise figures).

A not unsensible combination that provided a substantial real 3.3% increase in the NHS England budget (OBR Table 5.4) that when, hopefully, combined with the early beginnings of necessary embedded and continuing future productivity and efficiency gains, should provide at least a temporary respite to some of its structural funding and delivery challenges.

Yet, overall, the budget only kicked the real fiscal can down the road. In a muted reprise of Conservative fiscal dishonesty, most departments face limited increases or even real term cuts in their budgetary allocations beyond 2024-25 (subject to 2025 Comprehensive Spending Review decisions).

It yet again froze fuel duty during a period of falling fuel prices at the beginning of a government term when it can better ride out short-term negative reactions. If not now, when? Sure, an increase could have added to cost-of-living pressures (more especially in rural areas) but the new government lost an opportunity to introduce a wider narrative consistent with its decarbonization vision.

That could have included a pledge to adjust the duty with future fuel prices to smooth future net price volatility more conducive to consumer and business budgeting.  

Making the current budget balance will mean a combination of future cuts and/or further tax increases, unless future economic growth surprises on the upside (see section four).

The political risk for Starmer’s Labour government is that its own fiscal dissembling will come back to bite it, especially given the shallow popular base of its 2024 victory (its high majority was a product of the efficient distribution of its vote, not its relative volume) and the secular trend for greater electoral volatility and fragmentation.

It could have to paying a continuing and mounting economic and political price for becoming an increasing hostage to the RFCS, however much it twists and turns to escape its clutch.

The unfreezing of income tax thresholds in 2029-30 no doubt will be presented then as a tax cut pre-next election (it may also avoid the triple-lock pension being taxed when received as sole source of taxable income) amid, quite possibly, another proclaimed self-denying ordinance on future direct tax rates, thus repeating and in the process entrenching the fiscal circus cycle yet again, something that may or may not prove electorally successful.

At the end of the day, treating the electorate as children unable to grasp economic and financial realities is not sustainable in strategic political terms in either narrow party or national interest terms.

Sooner or later the music will stop, while the further embedding and entrenchment of popular distrust and cynicism pervading politics can only undermine and corrode the democratic process itself, risking destructive results.

There is no easy way of the RCFS in either political or policy terms. Few of us welcome political messengers telling us that we should pay more tax upfront or must accept reduced public service quality and coverage.

Better the pill sugared, disguised, or even better postponed, even though it might make the pain worse sometime in the future. After all, something might turn up; why put your head above parapet to be shot, until you must?

Council tax reform towards aligning payment to current housing values combined with the phasing out of housing stamp duty (see this Dan Neidle post for a clear and informed discussion) and getting the financially comfortable elderly to pay more towards their health and social care seem to provide the most obvious possible partial escape routes out of the RCFS but still involve considerable political management risk.

Certainly, at least some political groundwork should start to be laid to shift the tax burden away from productive activity towards wealth and to better link individual contribution to potential benefits received, where possible and appropriate.

Less politically challenging and more attainable sooner rather than later is making public spending more effective and productive. To that necessary but not sufficient route of the RCFS, the next section turns.  

2             Fiscal Institutional Reform to Make Public Investment Planning and Delivery More Efficient and Effective

The budget set out a two-pronged revised fiscal framework. The stability rule will require the current budget to be in forecast surplus in 2029-30 (as assessed by the OBR) until that year becomes the third year of the forecast period in 2026-27.

From 2027-28 onwards, the current budget must then remain in balance or in surplus from the third year of the rolling forecast period (for example, from 2030-31 in 2027-28).  Balance is defined as a range: in surplus; or in deficit of no more than 0.5% of GDP.

The second prong – the investment rule – will require net public debt, now defined as Public Sector Net Financial Liabilities (PSNFL), to fall as a share of the economy (GDP) by 2029-30, until, like the stability rule, 2029-30 becomes the third year of the forecast period in 2026-27.

Then to meet that rule, net financial debt (PSNFL) should fall as a share of GDP by the third year of the new rolling forecast period: 2030-31, if assessed in 2027-28.

In addition to the stock of debt that the Public Sector Net Debt (PSND) measure previously captured, the replacement PSNFL or net financial debt measure now includes financial liabilities, such as funded pensions obligations and government guarantees.

Crucially, however, it also nets off illiquid financial assets, such as equity holdings and loans, from total financial liabilities to calculate the headline net financial debt metric.

The Treasury in support of this change pointed out in its Red Book that by failing to count financial assets, the previous PSND metric could create an incentive for the government to forgo profitable and growth enhancing investments, such as that are expected to be made by the National Wealth Fund, despite any positive future impact upon the economy and their ability to yield a positive return for the taxpayer over their lifetime(s).

Yet PSNFL does not recognize the value of physical public assets, including road and railway networks, and public housing.

Its use, therefore, risks creating a new set of perverse incentives for government to make investments in financial rather than physical assets, making loans and issuing guarantees in preference to investing directly in productive assets, simply to accord with the investment rule rather than because of overall long-term value-for-money (vfm) grounds.  

Indeed, it does seem that PSNFL was made the primary debt metric for fiscal rule measurement purposes mainly because it provided the government with additional expenditure headroom in the desired format: the most expedient rather than necessarily the most optimal measure.

It did enable the budget to announce a total increase in planned public capital investment of around £100bn over the next five years over and above previously planned levels.

As the prequel to this post argued, it would, however, have been better for the chancellor to make the case for additional investment clearly, directly and transparently, according to its economic and thus fiscal sustainability merits, rather than tweaking fiscal second order rules that when political push comes to shove inevitably tend to be gamed or changed.

As way of historical context, Conservative governments in the early nineties tended to rely upon second order objectives, such as the exchange rate, to bear down on inflation rather than making low and stable inflation a first order objective supported by reformed institutional architecture as New Labour did to notable success in 1997.

Whether the new investment rule is met or not will depend upon a range of factors, including future inflation and interest rate trajectory, and growth and productivity outcomes. These the government can only at best partly influence by its own policy and other interventions.

It will then rely upon the OBR to adjudicate whether the rule is on track to be met according to that organisation’s forecasts.

At present, the OBR is only about 50% confident that its current assessment that the government post-budget has about £15.7bn fiscal headroom to meet the investment rule will prove accurate.

That headroom could vanish in a flash in the event of an external shock or be dissipated by lower than forecast growth – which the OBR has a history of over-estimating – leaving a lot to contingent hostage, including, for instance, that growth will even reach two per cent in 2025.

Whether the new investment rule is met or missed by a percentage point or so according to the chosen measurement metric of the day is unlikely to make much material macro-economic difference.

The clear and present danger rather is that investment projects that would generate returns over their cost of provision (including their capital opportunity or cost of capital costs) will be shelved, delayed, or pared back simply to keep within the investment rule target three to five years thence, according to forecasts and assumptions that may or may not be realised that invariably can shift with the short-term economic environment and its associated noise.

Undoubtedly the government must maintain wider market confidence that its fiscal position is sustainable. Otherwise, interest rates will rise, sap growth, and offset or dissolve the benefits of such productive public investments.

But the investment rule sidesteps the imperative to increase effectively selected and prioritised productive levels of public investment closer to economically optimal levels requiring chosen programmes and projects to be both efficiently selected and delivered.

The budget did announce some steps and “guardrails” to ensure improved investment outcomes, including:

  • publishing a 10-year infrastructure strategy alongside phase two of the forthcoming spring 2025 CRS, outlining the government’s long-term approach;
  • setting five-year capital budgets and extending them every two years at regular spending reviews, to “provide more certainty”;
  • increasing the transparency of investment decisions by publishing the business cases for major projects and programmes.

At a more substantive institutional level, the National Infrastructure and Service Transformation Authority (NISTA), combining the functions of the existing National Infrastructure Commission and the Infrastructure and Projects Authority, will be made operational by spring 2025.

NISTA will then become responsible for implementing the government’s infrastructure strategy, validating business cases, prior to HM Treasury funding approval.

The budget also finally announced the formal launch of the Office for Value for Money (OVM), with the appointment of an independent Chair, who as a first step, will advise the Chancellor and Chief Secretary to the Treasury on decisions relating to the multi-year spring 2025 CSR.

The wider remit of the OVM will include an assessment of where and how to root out waste and inefficiency; the undertaking of value for money studies across high-risk areas of cross-departmental spending; the scrutiny of investment proposals to ensure they offer value for money; as well as working with the National Audit Office (NAO) to benefit from that organisation’s scrutiny of capital projects to learn lessons for application to future projects.

Although these represent potential steps forward, the respective roles of NISTA and OVM are not clearly demarcated and appear to partly overlap.

A potentially more fundamental and possibly related possible shortcoming is that they are not statutorily defined as entities independent of the Treasury, even though their future effectiveness will depend on their own institutional clout and resourcing.

Their creation and development should have been and should now be made central and integral to the government’s overarching growth mission and commitment to economic and fiscal sustainability – not a subsidiary budget add-on.

The long-term impacts of public investment: social housing as a case study

The OBR has estimated that the additional public investment over and above the previous government’s plans as announced in the budget should directly increase the total potential output of the economy after five years by 0.1%.

That could increase to 0.3% after ten years if the planned increase is maintained, as the resulting output effects rise over time while implementation time lags recede.

If that increase further levers-in complementary private investment and human capital upskilling, the GDP uplift could reach 0.4% after ten years and 1.4% after fifty years.

However, the OBR believes that the economic benefit of the increased public investment will prove more muted due to the impact of higher public borrowing on interest rates and the associated limited complementarity crowding-in of private investment.

Although it should increase incentives for businesses to invest, that broader crowding out effect of the budget’s net fiscal loosening, driven by a sustained increase in real government spending as a share of GDP within a capacity-constrained economy, is forecast by the OBR to reduce business investment by the end of the five-year period.

Such conclusions, including the differential macro-economic impact of different categories of public spending, such as public investment and government spending on current services (consumption), are dependent on the econometric assumptions that the OBR applies, based on its interpretation of the empirical literature. 

Alternative interpretations of that literature, such as here, have queried whether the OBR’s assumptions on the impact of public investment through its fiscal multipliers on output, and on the future total supply capacity of the economy (and thus its ability to absorb increased output without inducing inflation), are too conservative.  

Moreover, public housing investment is singled out by the OBR as less growth enhancing than alternative investments in enhanced economic infrastructure, including on transport networks, on water supply, and on sewerage, implying that its net economic effects could be negative over the long term.

As way of contrast, an October New Economics Foundation paper argued that as public grant supported social housing would not otherwise be built, the socio-economic returns that it generates is higher than private housebuilding.

It cites the high construction multipliers associated with housebuilding (for every one pound generated directly, a further £1.43 is generated indirectly and through wider spending in the economy) on top of tenure-specific social returns linked to lower housing benefit expenditure, reduced homelessness and family dislocation, and through its employment-enhancing effects increasing taxation receipts and reducing social security expenditures,

In sum, according to the NEF, building 365,000 social homes – the minimum number it assesses are needed to deliver the government’s 1.5m housing delivery target – would yield, aggregating all the above gains, total gross economic and social benefits of around £365bn over 30 years.

Net of public investment costs – in terms of central government grant and local authority expenditure – its total net benefit is posited at £225bn over three decades, with every one pound of the up-front public investment required to deliver that volume of social housing generating more than £2.60 for the wider economy in return.

The paper links a rising proportion of that overall economic benefit exclusively to the social rent sub tenure (let at around 50% of market rents depending on location) with 43% (£158bn) of this total gross economic and social benefit attributed specifically to that sub tenure.

That final net benefit figure reflects proposed changes to the social discount rate (SDR) currently applied in accordance with Treasury Green Book methodology.

An SDR of two per cent applied to social housing investment, less than the Treasury’s current standard 3.5% – still above Germany’s SDR and in line with the general US government SDR, which was reduced to two per cent earlier this year – would result in the 365,000 social housing programme generating £50bn more in net present social value benefits compared to the current Treasury approach.

These results, of course, are like the OBR’s, predicated on organizational and study-specific assumptions applied, which likewise, are challengeable, especially when they are drilled down on.

No account is taken of the likely crowding-out effects of such a programme. Leaving aside, the possible impacts of resulting higher levels of borrowing on interest rates, its impact on a capacity constrained construction industry is almost certain to lead to material and skilled labour bottlenecks and resultant sector-specific inflation – at least in the absence of concerted and focused public interventions undertaken in partnership with industry suppliers in step with its scaling up. 

The NEF paper also assumes that the overwhelming demand for social housing will mean most of the economic benefit of investment in social housing is likely to be realized.

That, to say the least, is a heroic assumption. Based on past empirical experience of employment levels within the Social Rent (SR) sub-tenure, it is far from certain that, in practice, an expanded SR programme by itself will increase overall economic activity levels.

Although reduced levels of homelessness can be reasonably expected, social returns relating to family stability and improved health will prove more difficult to demonstrate rather than to state and assume.

An extended 30-year period is especially prone to uncertainty and confounding impacts, and so on.

The NEF study, did, however, clearly explain and define in plain English its underlying assumptions rather than rely, as the OBR tends to do, on econometric equation notation unintelligible to most lay audiences (the NEF paper’s appendix on social discounting is a commendable model for general replication).

What can be more safely concluded is that the economic and social impact of an expanded SR programme is a highly important and relevant issue that requires and needs further dedicated evidence-led and transparent scrutiny and assessment.

This is where both NISTA and the OVM could and should play pivotal and instrumental roles. 

 3           Labour’s Housing Delivery target

The chancellor in her budget speech termed Labour’s 1.5m housing delivery target as “a commitment”, which was worrying insofar that it rather suggests that she does not understand that it will not be achieved for the reasons explained here.

It risks becoming a distraction from the more sensible and realistic goal of laying the foundations of a sustainable 300,000 annual new supply level by the end of this parliament in 2029.

Most commentators consider that to meet the existing and future needs of those not able to afford market costs, an annual and sustained Social Rent (SR) programme level of at least 90,000 dwellings in England, plus another 30,000-50,000 of intermediate sub tenure, is required.

That roughly corresponds roughly with what is consistent with the achievement of a sustainable 300,000-plus annual new housing supply in England, assuming that annual private speculative market supply, going forwards from 2027-28, can be sustained at the 170,000-180,000 dwelling level (see previous link for more detail).

The budget did announce a £500 million uplift to the 2021-2026 Approved Development Programme (ADP) – from which public grants to support affordable housing provision are made – increasing its 2025-26 budget to £3.1 billion, while making the claim that is “the biggest annual budget for affordable housing in over a decade”.

It should, according to the budget announcement, enable 5,000 additional (SR + intermediate) affordable dwellings to be provided, over and above previous plans. An average unit public grant support of 100K is thereby implied, suggesting that most of these newly provided dwellings, if delivered, will be let at SR levels within high cost and high need metropolitan areas.

Putting that into context, recent annual levels of SR provision are running at around 14,000 , which even if increased by 5,000, will remain way below the above required 90,000 level.

Stepping up to that would require additional annual public grant support, phased up and then sustained in the £4bn to £10bn range. Precise future funding requirements will depend on the location and the provision outturn costs of the units provided, as well as on the future relative contribution of S106 affordable housing obligations to the 90,000 dwelling total.

The chancellor went on to confirm that “to deliver on the commitment to get Britain building”, the government in the spring 2025 CSR will set out further details of future grant investment allocations beyond the current ADP and that these will run for at least the duration of this parliament and support a mix of tenures, with a focus on delivering homes for SR.

Clearly, the spring 2025 CSR housing settlement will prove pivotably crucial to the government’s housing ambitions. The budget advised that the CSR will take a “mission-led, reform-driven, technology-enabled approach to funding public services, while investing in long-term growth”.

We can only wait and see the outcome of that late next spring, which should allow us to model more definitively expected levels of affordable provision and its contribution to the government’s delivery target to the end of this parliament and beyond.

In that light, it is unfortunate that the fiscal institutional reforms that the preceding section discussed are unlikely to be operative in time to comprehensively contribute within the forthcoming CSR to a more evidence-led and transparent consideration of the economic and social benefit of additional SR and intermediate provision relative to their up-front public investment costs.

Hopefully, however, that consideration is accorded sufficiently high priority within both the portals of the Treasury and the nascent NISTA and OVM, for a useful stab in that direction to be made.

Other housing fiscal measures that the budget announced included providing an additional £233m to prevent homelessness, taking total spending to one billion on that in 2025-26, an increase designed to prevent rises in the number of families in temporary accommodation and to reduce rough sleeping.

An additional £3bn was also announced to support for SMEs and the Build to Rent sector in the form of housing guarantee schemes, designed to help developers to access lower-cost loans and to support “the delivery of tens of thousands of new homes”.

At a more micro level, £10m of funding was assigned to enable the Cambridge Growth Company to develop an ambitious plan for the housing, transport, water and wider infrastructure to unlock and more fully realise the economic growth potential of that high value-added sub region.

Curiously, housing benefit housing allowances were frozen. Although that might offer central government a revenue saving, it can only be expected to add rather than reduce homelessness problems and their associated revenue costs that largely fall on cash strapped local authorities.

Perhaps, the freeze is a precursor to a wider strategic drive to shift low-income tenants out of insecure private rentals and into SR at a lower public HB cost, which the 2025 CSR will progress as part of a wider housing strategy. It is , however, rather suggestive of non-joined up thinking that will have arbitary results.  

This is another issue that could benefit from some future OVM scrutiny and NISTA consideration analysis of the longer-term cost-benefit consequences of such a shift from the PRS to SR.

4       Waiting for Mr Growth

The government has confirmed that this and future budgets will be a once-a-year fiscal event focused on tax, spending, and borrowing decisions only, separate to the government’s wider growth-enhancing strategy and decision making. 

The OBR forecasts that the economy to grow by 1.1% in 2024, increasing to two per cent and 1.8% in 2025 and 2026, before returning to around the OBR’s current estimate of its sustainable non-inflationary potential growth rate of around 1.5%, 1.5%, and 1.6% in 2027, 2028, and 2029, respectively, remaining below pre GFC levels. Such levels would generate insufficient resources to reset public services for a rising and ageing population onto a sustainable path.

Even these muted levels may not be realized. The OBR has a forecast track record of optimism bias. Evidence of private sector ‘animal spirits’ or even confidence is currently difficult to discern, as are drivers to uplift private consumption, investment, and productivity.

Trumpian trade tariffs and the risk of further international instability in the Middle East and Ukraine represent further downside risks.

The main expected contributor to growth, higher government consumption, unlikely by itself to materially improve productivity and sustainable growth, and will be dependent on 2025 CSR decisions and outturns.

As Section Two discussed, increased public investment, although expected to have a short-term positive impact on GDP will, according to the OBR, have a limited and slow impact on longer term growth outcome due to low or even negative complementarity (crowding-in private investment) and output/fiscal multiplier effects, although, as the preceding section discussed, the assumptions used in the in-house study that the OBR used, determining that result, appears pessimistic.    

Moreover, OBR forecasts take account only of already announced government policies and their expected impacts, not possible future policies, such as changes to the National Planning Policy Framework that the new government proposed in July 2024 that together with wider planning reform and future National Wealth Fund activity, the government is relying upon to catalyse an upward shift in the future growth trajectory.

The OBR did recognise in its budget outlook that future planning reform when finalized and implemented could result in its housing supply forecast proving pessimistic, providing an additional domestic growth driver.

However, planning reform alone (see previous link) will not result in the government’s flagship 1.5m delivery target being met.

Although it might succeed in pushing up the number of planning permissions granted above its current historically low levels, their translation into future housing construction activity will be uncertain and partial.

The current private speculative housing model is predicated on the secure prospect of rising house prices and the ability of dominant suppliers to dribble out supply to maximise margin not volume. On the public delivery side, it is unlikely that CSR 2025 will provide increased allocations anyway near consistent with a new annaul supply step increase to 300,000 dwellings in England.

The next generation of New Towns will not come on stream substantively until the next decade. Their funding and provision models will need to be developed over the next year or so in such a way that public investment inputs can be stretched and private investment levered in.

The National Wealth Fund as a source of pump-priming investment supported by pension fund reforms – if they prove effective and timely – could allow a shift to a partial public contracting partnership model – something the change to PSNFL measurement metric (see section two) could help to enable in public accounting terms.

But, in truth, the public action way forward to higher growth is currently hazy and undefined.    

Some minor editing changes ti improve clarity were made on 24th November to the orginally posted version.

Share this:

  • Click to share on X (Opens in new window) X
  • Click to share on Facebook (Opens in new window) Facebook
  • Click to print (Opens in new window) Print
  • Click to email a link to a friend (Opens in new window) Email
  • Click to share on WhatsApp (Opens in new window) WhatsApp
  • Click to share on LinkedIn (Opens in new window) LinkedIn

Filed Under: Economic policy, Housing, Real Fiscal Crisis of the State Tagged With: housing, planning, public finance and budgets

Social Housing Investment, Fiscal Institutional Reform, and Labour’s Delivery Target

21st October 2024 by newtjoh

This is the second post of this series delving into the new government’s 1.5m housing target (delivery target), its definition and measurement, its phasing and prospects of achievement, and its relationship to existing public and private delivery systems.

The first showed why the government’s delivery target will not be met; to approach a sustainable 300,000 annual supply total by the end of this parliament will prove a policy and delivery challenge.

Achieving that more realistic but necessary baseline goal, while steering policy direction towards a reformed housing system that mainstreams affordable housing supply across both public and private delivery systems at volumes consistent with national economic and social needs, would be a momentous achievement. Its pursuit should now concentrate government, think tank, and media minds.

The core message of this post is that the contradictions currently inherent within both the existing public and private delivery systems should be relieved by a progressive shift to a partial public contracting model.

Shifting to a that model – at least on large sites – on a Letwin-plus basis (the government’s New Town programme, mayoral and other development corporation housing interventions, and the development of strategic spatial and sub-regional planning are moves along that groove) could and should progressively reduce the current reliance on the currently predominant private speculative model, which, in its present guise, is incompatible with the achievement of the government’s housing objectives.

The first section defines the overarching real crisis of the fiscal state constraint, relating the progressive emergence of affordable housing obligations secured through the planning system (S106) as the primary provision route of affordable housing in lieu of direct public grant support, to its strengthening hold.

It concludes that current economic and housing market conditions combining with the operation of the private speculative model will mean that S106 cannot be expected to contribute substantively in the short term to the expansion of affordable housing levels consistent with the government’s ambitions; prospects of a period of sustained rising house prices might allow S106 volumes to increase in the medium term but will also be accompanied by worsening affordability and access problems for moderate income potential first time buyers.

The second, underscores that a sustainable annual new supply level of 300,000 dwellings-plus requires publicly funded or-enabled affordable housing (predominately public grant-funded) to account for 40%-50% of total supply.

Such a requirement, however, is attached with an additional annual public borrowing requirement that, disregarding even other housing and infrastructural demands, could reach £10bn. This seems wishful thinking in the face of Labour’s fiscal framework that requires public debt to fall by between the fourth and fifth year of  a rolling forecast period (debt rule) and other competing demands for scare public resources.  

The linkage between increased public investment and the new government’s overall core objectives does, however, make it is likely that debt rule will be tweaked in the October budget to provide some added fiscal space for investment.

Fiscal institutional reform capable of making the selection and implementation of public investment projects more efficient and effective supportive of financial market and wider confidence in the government’s sustainable stewardship of the public finances, would help to protect and increase that fiscal space for productive public investments.

The third section, in that light, presents a broad ‘stocktake’ of the investment case for Social rent (SR), including its direct and indirect financial, economic and social benefits, balanced against some possible disbenefits, beyond merely repeating the need for a 90,000 annual SR programme, to encourage some honest disinterested debate on its utility and desirability relative to alternatives.

The qualitative, selective, and non-systematic nature of such a stocktake, however, underlines the case for the institutional reforms the previous section made to provide a much more granular and evidenced base to inform and support public policy development and discussion, widening the scope for feasible and needed action to weaken the destructive impact of the fiscal crisis of the state.

The fourth and final section sketches out some short-to-medium term contours of a partial public contracting model to further a vision where affordable housing is mainstreamed within a public-private partnership planning model focused on maximising supply, quality, and affordability.

1          The Real Fiscal Crisis of the State and Affordable Housing Obligations (S106)

The new government is committed to both strengthen the affordable housing obligations system and to “deliver the biggest increase in social and affordable housebuilding in a generation”. What it precisely means by that remains to be seen, however.

Unless private supply for sale exceeds 180,000 dwellings on a sustained annual basis (only fleetingly touched during the 1988 Lawson boom, which soon imploded into bust), a future sustainable steady state 300,000-plus dwelling annual supply from 2027 onwards would require a publicly financed or enabled affordable housing annual delivery level of at least 120,000 dwellings, comprising a mix of SR and intermediate ‘affordable’ sub tenures.

Annex-Table-Four puts that into some policy and historical context, reporting that affordable provision peaked just shy of 75,000 dwellings in 1995-96; in 2022-23 just under 64,000 were completed. Affordable starts in 2023-24 are likely to be considerably below that level, deflating 2024-26 completions.

The last SR delivery peak touched 40,000 dwellings in 2010-11, itself lower than the preceding 1995-96 peak of around 57,000.

Since 2010-11, the share of the affordable supply total taken by dwellings let at Social Rent (SR) levels plummeted. Although recovering slightly recently, in 2022-23, only around 14,000 were completed (including London Affordable Rent, let close to SR levels).

Both Labour and Conservative governments in the post-Thatcher period have struggled to maintain affordable supply, especially of SR, due to increased fiscal pressures and a political unwillingness to prioritise housing relative to other spending programmes.

A core overarching constraint was and remains the real crisis of the fiscal state: the mismatch between the public expenditure requirements of the UK (assuming a continuing public desire and demand for accessible and universal public services on the European social democratic model) and the political and electoral willingness for them to be met through forms of taxation that are efficient, sufficient, and transparent.

Its growing grip and impacts pervade public policy development setting, discouraging honest political discussion on and responses to public policy challenges.

Governments increasingly relied upon, first, stock transfers, and then securing affordable housing through the planning system (S106) to bolster affordable housing supply: by 2022-23, as Annex Table Five catalogues, nearly half of all affordable provision was secured through S106 without the use of public grant.

It had become the primary funding mechanism of affordable housing, almost by accident, one manifestation of the fiscal crisis the state, of many: a story recounted in Section 1 of  The new infrastructure levy: going-round the mulberry bush.

S106 involves cross subsidising the provision of affordable dwellings at discounted prices from the overall profits generated by private scheme developments.

Its operation ultimately depends upon higher house prices generating higher profits from scheme market sales – a process that tends to perpetuate affordability and access problems for first time market purchasers forced to climb a downward moving escalator.

The mechanism, however, can dampen land prices, especially if affordable housing requirements are made certain in policy and valuation terms causing them to be embedded in the development process, conducive to greater public capture of the enhanced values generated by the granting of planning permission for residential and other development above the existing use value of the land.  

This appears to be the government’s intention concerning new housing development on Green and grey (GGB) belt land, where it expects 50% affordable housing (with an appropriate proportion being SR), subject to viability, to be provided alongside the necessary supporting physical and social infrastructure, including transport connections, schools, and GP surgeries, as well as additional or improved green spaces (a-c, para 155).

Three main mechanisms were advanced in the July draft National Planning Policy Framework  (NPPF 2024).

First, the above ‘golden rules’, when translated into planning requirements that policy compliant developments must adhere to, should deflate land costs (and/or developer profit margins) as explained.

Second, the setting of benchmark land values (BLVs) that for viability purposes keep land acquisition costs close to their existing value.

Third, further reform of compulsory purchase order (CPO) rules, including use of directions to secure ‘no hope value’ compensation where appropriate and justified in the public interest – in effect to act as a backup default stick and to encourage voluntary exchanges at levels higher than existing use but at still deflated BLV values.

However, para 28 of the accompanying consultation document also recognised that the S106 contributions that can be secured from development will vary between areas, and between individual sites: some areas have lower house prices; some sites will have abnormal costs; Community Infrastructure Levy (CIL) rates vary between those local planning authorities which charge it (and some, like London borough of Ealing do not charge it all); and existing use values of sites will vary.

It also recognised that the limited use of viability assessments could be necessary, where negotiation is genuinely needed for development to come forward, particularly in relation to affordable housing requirements, but emphasised that viability processes should not be used as an excuse to inflate landowner or developer profits, contrary to the public interest.

A 50% affordable housing requirement could comprise different sub-tenure composition permutations, ranging from 100% SR to 100% intermediate, attached with different cost and value implications to the developer and the LPA.

Although the 2024 NPFF reaffirms that LPAs are best placed “to decide the right mix of affordable housing for their communities, including a mix of affordable homes for ownership and rent”, they will be required to explicitly consider the needs of households that require Social Rent (SR).

The government has also signalled that it intends to rebase the Approved Development Programme (ADP) towards SR provision.

The underlying bedevilling problem is that while a national policy requirement offers universal certainty and clarity, differing site and area circumstances are not amenable to a one size fits all approach.

Another is that little consensus exists on what a “reasonable and proportionate premium” to the landowner should be, subject not only to varying technical and policy considerations but also to commercial interests and to political and social value judgements.

According to many developer and property consultancies, this 50% affordable housing requirement will likely render development schemes on GGB land unviable, further noting that a similar requirement on publicly owned land simply led to their mothballing.

The arguments used to justify that position, such as Benchmark Land Value – fine margins (knightfrank.com), are predicated, however, on the unreformed operation of the existing speculative housing model, which is driven by margin rather than volume maximisation, encompassing assumptions that landowners/landowners require approximately a fivefold return on investment for them to promote sites to, and take the risk of, planning approval, as well as 20% developer profit.

The government thus is facing two ways that threaten to pull in opposite directions. To deliver its desired but unprecedented sustainable higher levels of housing, including affordable, supply, it remains reliant on the current private speculative model inimical to its realisation.

Deflating the development cost and value through local planning policies that incorporate affordable housing requirements, including more Social Rent (SR), and moving BLVs for viability purposes closer to existing use values, are inconsistent with the unreformed operation of that model.

Nor will it do anything to encourage, induce, nor force developers to build both more and quicker in contrast to dribbling out supply. For larger schemes that means over decades rather than the short- or even medium-term.  

Insofar that recent market conditions and cost pressures have reduced the scope for its operation, S106 cannot be expected to deliver a substantive increase in affordable housing supply – at least across the short term.

Rather a trade-off is likely to be encountered between maximising the overall volume of affordable housing delivered via obligations and the SR proportion – without the injection of additional public grant support that is.

Indeed, a consensus has emerged between public and private stakeholders that the government must substantially increase its direct grant support of SR.

2          Social housing investment, the fiscal framework and its institutional reform

Most commentators consider that to meet the existing and future needs of those not able to afford market costs, an annual Social Rent (SR) programme level of at least 90,000 dwellings in England, plus another 30,000-50,000 intermediate is required – roughly the same level required to achieve a sustainable 300,000 annual housing supply.

But, as the academic who has helped to mould that consensus through a lifetime of research on modelling housing need and affordability, recently recognised in Housing Requirements in England Revisited that “it is one thing to identify (such) requirements in an ideal world, and another to promote a financially viable programme in a fiscally constrained environment”.

The fiscal cost of such a programme would require annual additional public borrowing at £5bn-upwards as the table below indicates on a back of an envelope basis, depending upon average unit grant and provision cost outturns related to geographical and site distribution, as well as its sub-tenure distribution.

Table 1

Additional volumeUnit GrantTotal (bn)
50,00050,0002.5
50,000100,0005.0
75,000100,0007.5

Total fiscal cost, accordingly, could exceed £10bn if grant was skewed towards high cost/need areas including London, where land and provision costs, as well as the need for SR, are highest.                                                           

Table 1 figures also do not take account of other priorities such as bringing the existing social stock up to post-Grenfell standards, nor includes the pump priming and infrastructural investment that will be needed to fast track New Town and large urban extensions to come substantially on stream within the next ten years.

That said, even such significantly increased levels are not that massive in the wider fiscal scheme of things. For instance, limiting pension tax relief to the basic rate, according to Table 1 of this Institute of Fiscal Studies pre-budget comment,  could yield £15bn annually.

Perhaps, more pertinently, on the capital side of the public accounts, public sector net investment this year is forecast to be £67 billion (2.4% of GDP) with the Ministry of Housing and Local government (MHCLG) accounting for around a £7bn share of that.    

Any increase would necessarily also be subject to gradual scaling up over the lifetime of this parliament.

Nevertheless, increases in social housing investment on the scale indicated by the table – given also other competing pressures for investment – will likely run counter to the new government’s fiscal rule framework, at least as it is currently construed.

Indeed, Angela Rayner, the Housing and Communities Secretary, one of the handful of cabinet ministers responsible for ‘unprotected budgets,’  who was reported as having written to the chancellor, having asked for an additional £4bn, to complain about the inadequacy of their 2025-26 allocation (presumably less than that) due to be announced as part of the 30 October budget.

While allowing borrowing for investment, Labour’s fiscal framework also requires debt to be falling as a proportion of gdp (gross domestic product) between the fourth and fifth year of a five-year rolling forecast period (the debt rule), as verified by the Office of Budget Responsibility (OBR).

The informed cross-political and economist consensus is that such a debt rule is flawed in design and will prove counterproductive in outcome, as it threatens to crowd out productive investments needed to put the UK economy on the upward growth and productivity trajectory that is fundamental to the government’s growth and sustainable public finances: it should therefore be dropped as a ‘bad’ fiscal rule.

But given the political capital that Labour and the chancellor has expended on the paramountcy of the fiscal rule framework and its “non-negotiable” status, its outright abolition would constitute a surprise.

Rachel Reeves, however, did say in her September speech to the Labour Party conference that it “was time the Treasury moved on from just counting the costs of investment in our economy to recognise the benefits also”.

Indications are indeed swirling that the Treasury will tweak the debt rule component of the framework at a definitional and interpretive level to provide added fiscal ‘headroom’ space for future increased growth enhancing investment (for more detail, see this Institute of Fiscal Studies pre-budget briefing).

What is counted as debt could be changed, excluding, for example, Quantitative-Easing (QE)-related losses incurred by the Bank of England requiring Treasury indemnities.

Another posited change is to make public sector net worth (PSNW) a key measurement metric for fiscal planning purposes.

PSNW records not only the debt incurred in creating a public asset but also its value as a non-financial asset within PSNW.

Its adoption, according to the Institute of Fiscal Studies (IFS), could also give the government greater incentives to invest in higher-quality projects and to manage and maintain its assets better.

At a balance sheet level, private companies and individuals when they borrow to buy a fixed long-term asset as an investment, such as housing or plant, measure its net value by subtracting remaining debt liability (principal outstanding minus repayments) from its current asset value, and then budget to meet the resulting debt costs.

Public assets cannot usually be sold to repay debt nor directly produce tangible direct revenue streams to offset their debt costs (but see below regarding SR). Their valuation would also be complicated and possibly contentious and would risk becoming itself a fiscal measurement issue.

The IFS has made the sensible point that the specific measurement metric chosen matters less than making a coherent case for government to borrow more for productive investment purposes, rather than prioritising investment within a framework that has debt falling (as the chancellor declared was her intention before the July general election).

It is not alone. A Labour List article by a city economist made a similar argument that “the (fiscal) rules themselves are not what determines fiscal credibility, but the reputation of the government setting them”.

Accordingly, eliminating waste, securing better value-for money from departmental budgets by effective review and scrutiny mechanisms and having robust arrangements to allocate scarce resources most effectively “will have a bigger impact on how investors rate the government’s ability to pay its debts than the precise wording of the fiscal rules”. 

Fiscal Institutional Reform

Public investment must be productive in terms of the returns it generates relative to actual costs and resources consumed rather than invariably optimistic projections. Any increased investment budget must be demonstrably spent effectively.

That requires selecting the right set of projects and then designing and delivering them in a cost-effective way, a task that governments have all too frequently failed to achieve: HS2 providing a prime example.

The case for creating a policy environment that provides sufficient fiscal space for increased public investment at economically and socially needed levels, including on SR, should be accompanied and assisted by fiscal institutional reform making the selection and implementation of public investment projects more efficient and effective in a way conducive to the maintenance of financial market and wider confidence in the government’s stewardship of the public finances.

Some years ago in Investing in productive infrastructure this website presented a possible institutional model for that purpose, involving an expanded remit of the well-established National Infrastructure Commission (NIC), revisited earlier this year in Starmer and the Spring 2024 Budget, as an institutional complement to the Office for Value for Money (OVM), which, Rachel Reeves, when shadow chancellor, had signalled would help guide the strategic spending decisions of a future Labour government.

The remit for the OVM that she sketched out included identifying and defining system and budgetary changes to make programme revenue spending more effective, efficient, and economical in tune with long-term societal needs and demands, consistent with long-term fiscal sustainability.

Such a move to an institutional fiscal council type approach to major public investment appraisal and delivery would also be consistent with both better ultimate outcomes and for growing political support for borrowing for public investment, as well as for identifying successful possible complementary linkages with, say, the housing, research and development, and training programmes.

In that light, it  was deeply disappointing that the Starmer government did not grasp the opportunity within its first 100 days to adopt such a timely institutional reform emblematic to its core purpose, as the Cameron-Osborne-led coalition government did in 2010 with the establishment of the OBR and Blair-Brown did in 1997 with its granting of an independent monetary policy mandate to the Bank of England.

Institutional reform focused on effective investment and strategic spending planning and prioritisation could have provided some effective political and technocratic support for the its overarching growth and productivity mission and public service agenda within a period of necessary fiscal constraint.

Instead Its absence allowed a lot of ephemeral political noise to fill policy and political space that it could otherwise have filled.

It is possible that the Treasury as part of the autumn budget process will be required to produce a statement of benefits connected with key investment proposals.

That would be a start, but a sustainable and systematic process will undoubtedly require the establishment and development of clusters of specific institutional expertise, protected by an independent remit providing standalone clout similar to the OBR institutional model.

3          Why invest in Affordable and Social Rent Housing  

Investment in SR provides public assets yielding direct income (rent) that will tend to rise in real (inflation-adjusted, Consumer Price Index plus one per cent into the medium term) terms: an increasing financial flow.

SR dwellings could, at least in an accounting sense, also be sold for a price broadly reflecting the aggregated net present value (time discounted to reflect that money received in the future is worth less than the same amount received now) of their future rental streams, providing an asset value that could be used for PSNW measurement purposes taking account of depreciation (relating to cost of maintaining the asset as new, or replacing it over its deemed lifetime, which can be taken as 60 years or more in the case of housing).

As a historical illustration, council dwelling stocks were sold to housing associations from the late eighties onwards to generate a capital receipt, reflecting their future net present values, which was potentially available to finance additional social housing.

Receipts previously had been and continued to be generated by individual right-to-buy sales (this time at discounted market values to encourage sitting tenant purchase) that were mainly recycled back to central government to net off public expenditure totals.

Prior to 1996 (when the government introduced a mechanism to recycle such surpluses back to central government to net off rising centrally financed expenditure on HB), some councils with a large stock of interwar or early post war housing with low historic construction costs, such as Barking and Dagenham, generated large surpluses. As rents rose with inflation or higher, revenue outpaced outgoings on the debt incurred to build their stock, which by the eighties had either been paid off or had fallen to very low levels, eroded by successive decades of post war inflation.

Investment in council housing can likewise be expected to generate future financial surpluses at least over a similar long-term timespan. But by the same token, the real cost of its provision will be front-loaded in the short-to-medium term as will up-front public grant support (in lieu of recurrent revenue subsidy).

SR is let at around 50% of market levels (often less in London and other high value/cost areas; sometimes higher in low value cost areas) and that will be reflected in its PSNW asset value. 

The other side of that coin is that the sub tenure tends thus to be more affordable to lower income households than other types of more expensive rented accommodation; and where SR households need HB support, the public expenditure costs of such supporting them on comparable unit basis is less than it would be if they were in higher rented accommodation, especially in high cost/value areas (leaving aside impacts of housing allowance and other benefit caps).

Instructively, a 2022 Audit Commission Review of the AHP since 2015 reported, using government research, that in London, future housing benefit savings over 30 years would cover the cost of 69 per cent of the grant cost of providing new homes for social rent, rising to 110 per cent over a 60 year period, leaving aside any further savings in temporary accommodation and social care costs that may be realised.

That, however, is way beyond the short-term political horizon of governments anxious to demonstrate their fiscal probity and responsibility and economic competence within the parameters set by the fiscal crisis of the state.

Another problem is because such indirect posited or assumed returns are also not amenable to precise measurement or demonstration in outcome terms.

In short, we cannot be sure that a new SR dwelling will create a vacancy for a household currently in the PRS or temporary accommodation, allowing the higher HB or TA costs previously incurred by such a tenant to be saved on a permanent flow basis.

Public expenditure on HB could continue to increase in total real terms because of other socio-economic developments, including an expanded SR sector providing housing opportunities to a greater number of low-income people needing HB support. In truth, we don’t really know.

That said, the acquisition of poor standard PRS properties that tend to be inhabited by low income residents in need of HB support for conversion into SR, say, as part of a wider long term process of the replacement of PRS by SR for such households, leaving the PRS to cater for specific market segments aimed, such as Build to Rent (BTR), does appear to make intuitive and logical sense, albeit one attached with considerable execution risk.

Broader direct economic and external benefits, as well as some possible disbenefits

At a broader macro-economic level, proponents of increased public funding of SR, argue that it would lead to direct and accumulating multiplier effects on output and employment often at multiples of its initial investment cost, sometimes concentrated at a local or sub-regional level, generating public revenue receipts.

Their magnitude will depend on whether the resources utilised were previously employed. Gains will be higher during periods of recession, but during economic upswing periods higher investment in SR could contribute to emerging material and labour bottlenecks, rekindling inflation.

Higher interest rates could also be demanded by the gilt or bond market participants where they were concerned that government debt levels associated by rising public investment levels could undermine fiscal sustainability.  

A recent OBR impact of public investment on output paper estimated that a permanent, sustained 1% of GDP increase in net public investment allowing for depreciation would increase the potential output (increase in the sustainable growth rate) of the UK economy by 0.4% after five years and by 2.4% after fifty years, although that the return to the exchequer would be smaller with less than half of that estimated gdp increase recouped in additional tax revenues.

Its modelled results, if realised, therefore would be long delayed and less than transformative (although still necessary and useful) across the lifetime of this parliament.

As an econometric study it is heavily dependent on its methodological and parameter assumptions (including time lag effects). And, as the study itself recognised, the economic impact of public investment will vary according to its type and implementation effectiveness and efficiency.

Yet another manifestation then of the need for the institutional fiscal reforms that the previous section outlined. If executed properly, these should have an independent impact on future sustainable growth performance.  

Investment in housing is more akin to investment in economic infrastructure, such as power, water, and transport infrastructure. SR investment could have a bigger and quicker impact on growth than an ‘average’ unit of public investment.  

Certainly, publicly financed or enabled housing provided at levels sufficient to bring total supply delivery to a sustainable and steady level of annual level of 300,000 dwellings and above could by reducing inherent housing market volatility and its compounding impacts on wider cyclical macro-economic fluctuations, itself could offer an additional and potentially transformative benefit in making growth more constant and sustainable in time and composition terms.

An enlarged public-enabled affordable segment should ameliorate the proneness of net new supply to fluctuate in a lagged response to wider macro-economic and housing market conditions and public funding cycles: expanded public delivery of affordable housing to a higher steady state annual provision level would help to stabilise and smooth out the cyclical volatility that has bedevilled housing supply and the wider economy for past decades

As the housebuilding industry is not shy to point out, economic and housing market volatility presents a source of uncertainty for their business models, increasing their desired/required risk-adjusted rates of return, recognised by the 2024 CMA report as a possible partial justification for their supra-normal profits.

Smoothing such volatility would generate an immense macro-economic overall dividend, especially if it was meshed with effective supply side workforce planning and training interventions that should also help – at least across the medium term – to upskill and thus increase the real wages and career pathways for expanding numbers of the indigenous population to enter and progress in the construction/housebuilding industries, as well to mitigate the inflation risk associated with increasing housing investment across a construction industry with depleted capacity.

Such a supply intervention certainly should be integral the new government’s housing delivery plans and policy actions; otherwise, as increased housebuilding is likely to be held back by material and labour bottlenecks.  

Increased investment in SR and affordable housing, however, could be capitalised into higher land prices, as occurred in the nineties and early noughties, generating private rather than public returns.

Policy mechanisms such as the 2024 NPPF ‘golden rules’ and associated CPO reforms could potentially could counteract that tendency contingent on their implementation path and outcome.

The opportunity costs (potential alternative benefits foregone) involved in investing in SR rather than for alternative public investment purposes will also have to be weighed – even within MHCLG capital programmes – against alternatives, including pump priming investment in infrastructure by development corporations designed to unlock large sites for development as part of a wider strategy to further the government’s delivery target, as the final section will outline.   

More generally, the emerging identified cross-sector stakeholder consensus that the government needs to build 90,000 SR homes annually can conveniently ignore or downplay the need to change the nature and interaction of both public and private delivery systems, leaving the associated lack of innovation, poor productivity, inflated costs, and sticky supply response features inherent to the private speculative model, unchecked to cause further damage to economic and social outurns.

A September Housing Forum report on housebuilding costs reports that average costs to build a traditional three-bedroom, two storey, 90 sqm semi-detached house in the midlands on a greenfield site, where it is one of 200-plus similar new homes, would cost, assuming ‘average abnormal’ costs, £242,000, rising to £251,700 to future proof homes for emerging standards, including, for instance, electric charging.

These estimates apparently exclude both allowances for ‘contractor’ profit and for land purchase (study assumes that these will reflect ‘build costs’ and presumably expected contractor/developer profit), which when factored-in could take the estimate well north of £300,000.

‘Onerous’ S106 requirements, CIL, planning-related costs would also be additional, as would be the costs of “paying for infrastructure and to subsidise affordable housing which is required to be built”.

Costs in London would be roughly 25% more, as would building flats, especially high-rise blocks.  

Well, such cost levels would make a mass SR programme very expensive, underscoring that widely recognised levels of endemic waste, inefficiency, and project ‘padding’ should be pared back both to secure best outcomes for both private purchasers and for the public purse.

Some possible longer term social disbenefits

A continuous 90,000 SR programme would imply a near-binary housing system, where people either relied on SR or market purchase to access housing.

A 2007 seminal study by the late Sir John Hills, End and Means: The future roles of social housing in England systemically catalogued and analysed the possible positive and negative features of social housing.

It still repays careful rereading, pointing out that while sub-market social rents combined with security of tenure, when compared with substantially higher and less secure private rents and tenancies, should lighten the potential employment and poverty traps and thus encourage working age social tenants into employment, that posited advantage had not been fulfilled in practice.

Rather, he found that social housing tenants – even when personal characteristics were controlled (taken account of) – were more likely to be economically inactive, as well as less likely to move.

Hills suggested a range of possible reasons for that, including neighbourhood effects, lack of tenant understanding or information on employment options or their impact on net incomes, or even a dependency effect (and, as market rents have increased and restrictions on HB have tightened, it can be rational and prudent for SR tenants to stick tight), before concluding that no clear causal connections could be drawn, which as far as this website is aware, remains the case (see also discussion in rent and letting chapter of Making Sense-of-the-English-Housing-Statistics.

He offered in response a reform agenda encompassing targeted employment and tenancy support, and more flexible tenure options, including equity shares, designed to mitigate some of the above problems those connected with rationing identified below.

While supporting the case for social housing at sub-market rents to be a significant part of housing policy, he also suggested that the case varied across the country: stronger in high-cost areas, less so in relatively lower-cost regions, where the adverse side effects of more reliance on cash transfers and market-based systems could be weaker.

Hills also did not shy away from problems inherent to public rationed systems. These include the sharp differences in treatment between those who do and do not make it through the rationing process; limitations on choice for those who do so; incentives to, and suspicions of, fraud or manipulating circumstances; limitations on mobility; and lack of consumer power over providers and applicant dependence on local bureaucratic rules.

But it will take many years to scale up to a large SR programme, which, given the undoubted priority need to increase its supply, especially in areas with ballooning homeless and temporary accommodation numbers, clearly is an urgent ‘today’ problem and necessity.

Mono-tenure estates should still, however, be avoided, and tenure distinctions should be both blurred and variegated, as much as is possible and is feasible.

The multi-tenure approach adopted by Barking Council and its development company, BeFirst, appears, in that light, to be a model that could repay granular investigation and review in relation to its possible replication and development across future large site developments, whether undertaken by New Town, development corporations, or combined authorities acting strategically in partnership with other authorities.

Intermediate tenures requiring public subsidy provided at a lower unit level than SR should be better targeted towards households who would otherwise be unable to afford full market purchase.

This is to ensure additionality and thus avoid the deadweight costs associated with using public subsidy to help households who could have purchased anyway without it.  

Yet such targeting could lead to the same rationing – akin to those associated with means testing – problems identified with SR above.

But then, perfect answers to present imperfect problems are seldom available.

4          Moving to a partial public contracting and partnership planning model

The core message of this post is that the contradictions currently inherent within both the existing public and private delivery systems should be relieved by a progressive shift to a partial public contracting model.

This would be marked by public authorities supported by increased levels of enabling public investment, and by new financial intermediaries/instruments levering-in varied sources of private finance.

These authorities would set the masterplan requirements, secure the necessary planning and other approvals, assemble the land, and forward-fund enabling pan-site infrastructure, where necessary and appropriate.

Masterplan briefs would split sites into different segments/lots allowing a range of housebuilders to compete to build different types of properties offered at different price points, including those targeted at local potential purchasers at lower quartile levels.

They would harness private sector skills and initiative to provide but not fund enabling infrastructure and to build larger scale developments, according to set best design, quality, and efficiency standards.

Obviously working up such a model to practical realisation would be a detailed and complex process, involving many different stakeholders.  It is a process that the New Towns Task Force will need to kickstart and pioneer and provide demonstration examples.

Outline indications of what a shift to a partial public contracting model should comprise and progress are offered below.

Short term

  • Development Corporations develop expertise cluster in land assembly, using CPO as a last resort;
  • Mayoral, Combined Authorities and Development Corporations to work together and develop strategic plans/projects that could contribute to the progress of the government’s delivery target prior to more formal arrangements being put in place;
  • Identification of early demonstration projects linked to the government’s Growth Mission. Oxford/Cambridge arc;
  • CPO clarification and strengthening within Planning and Infrastructure Bill;
  • Infrastructure funding intermediary to lever-in private finance, perhaps linked to regulatory reforms of public pension funds to encourage institutional investment into housing.
  • New Towns Task Force scopes and presents blueprint options.

Medium term

  • the development of innovative forms of institutional infrastructural funding that would reduce the cost of development funding supporting development corporation activity;
  • ramping up and facilitating development corporations to master plan and manage large scale developments offering a range of property types and tenure at different affordability levels on a Letwin-plus model that would bring on stream a transformational step change delivery within ten years;
  • promote and foster partnership planning between public and private sectors through the mainstreaming of affordable housing across both;
  • Funding intermediary- cheap and certain loan finance, pension fund involvement, supplementing more certain and known public forward funding of infrastructure.

Lasting changes

Affordable housing mainstreamed within a public-private partnership planning model focused on maximising supply, quality, and affordability.

Share this:

  • Click to share on X (Opens in new window) X
  • Click to share on Facebook (Opens in new window) Facebook
  • Click to print (Opens in new window) Print
  • Click to email a link to a friend (Opens in new window) Email
  • Click to share on WhatsApp (Opens in new window) WhatsApp
  • Click to share on LinkedIn (Opens in new window) LinkedIn

Filed Under: Economic policy, Housing, Real Fiscal Crisis of the State

The 1.5m Delivery Target: Prospects and Issues

24th August 2024 by newtjoh

This is the first of three posts delving into the new government’s 1.5m housing target, its definition and measurement, its phasing and prospects of achievement, and its relationship to existing public and private delivery systems.

The second will focus on the ensuing implications for both public and private delivery system reform.  

The third will relate delivery of the target to the future definition and implementation of Labour’s fiscal rules.

1          Introduction, definitional and measurement issues.

Both the Conservative and Labour parties during the 2024 general election committed to deliver at least 1.5 million new homes in England during the lifetime of the next parliament – equivalent to 300,000 new homes each calendar year, 2025-29 inclusive.

Such a target in practice will need to be measured by the most comprehensive and accurate series available covering new build completions and total new supply – the Ministry of Housing, Communities and Local Government (MHCLG) net new supply series and its live Table 120.

This reports financial year (1 April to 31 March) outcomes more than 18 months in arrears, meaning that practically the period to be measured will be April 2024 to March 2029.

Let us put the vaunted ambition into perspective. According to that series between April 2021 to March 2023 about 212,000 new builds were completed each year during that most recent reported period (see Table One below).

Total annual net new supply (which includes dwelling gains from net conversions and change of use, minus demolitions, plus new builds) hovered just above 234,000 dwellings across both years.

Whether the new Labour’s government target concerns new build or new supply outcomes is unclear. For example, the first paragraph of the new government’s policy statement on New Towns confirmed that it is “determined to build 1.5 million new homes over the next parliament”.

Suffice to note that annual new build completions and total new supply will need to increase, respectively, by about 42% and 28% from the latest 2021-23 achieved annual levels to reach 300,000 dwellings.

Taking a longer and more pertinent view traversing economic and housing cycles, Table 1, instructively, reports that the annual average total supply across the entire 2006-23 period was c195,000 dwellings: c64% or less than two thirds of the proclaimed target.

Is the delivery of 1.5 million homes an ambition, a target, or a commitment?

The first is clearly aspirational, a target can always be missed and when applied generally loses its value as a measure, while a commitment suggests that all necessary and possible steps will and are taken to achieve it, come what way.

This post will refer to it as a target for consistency. It also assumes that the delivery of 1.5m additional dwellings refers to new supply provided or completed, rather than just newly built properties built (about 90% of new supply), although it notes and concludes for that to have any realistic chance achievement that it will need to be treated as a priority commitment.

Its realisation will prove tricky to both track and measure. The more accurate MHCLG table 120 new supply (net additions) table does not cover starts and therefore is not a forward indicator.

As it reports for the financial year ending 18 months prior to its November publication date, it is also a lagged one. The 2028-29 new supply outcome will not be officially published until November 2030, meaning that definitive measurement of the target will be delayed beyond the next election, although forward indicators such as EPC certificates, discussed below, could provide a relatively reliable forward indicator.

Although another MHCLG table 213 does report new housebuilding starts and completion data on a timely quarterly and annual basis, that suffers from systemic undercounting (delineated in the next section).

More seriously, because of construction lags and the overlapping impact of previous policies and conditions straddling successive governments (2024-26 supply outcomes will largely be outside the policy control of the new government as they largely depend on 2022-24 start activity), a total production or supply target based on completions over the lifetime of a parliament didn’t and doesn’t make much sense, other than as a statement of political intent (hopefully) or of spun aspiration (more usually).

The new Labour government has made the target central to its overarching economic growth ‘mission’ and within a month of its election announced robust planning reforms consistent with its achievement, indicating a seriousness of political intent.

But planning reform is one of several necessary but not sufficient changes to the policy framework that the remainder of the post will show as collectively necessary for the target to be approached.

In that light, the next section examines more systematically what it will mean in practice to achieve or approach the 1.5m target by the 2029 end of this parliament, given certain under delivery over 2024-26.

2          Projecting future 2024-27 new build activity and new supply

Section Five of the MHCLG’s latest new indicators of housing supply release advised that its data on Energy Performance Certificates (EPS) lodged for new dwellings provide a very close estimate or proxy to net additions or new supply.

At time of writing, however, such available EPC data is relevant to the immediate past 2023-24 financial year to be reported in November 2024 – that is until sufficient EPC data is reported to allow an initial view on the expected 2024-25 net supply outturn to be taken, the first year that will be relevant to the measurement of the new government’s 1.5m delivery target.

Table 5 (table numbers  are out of sequence as they have been reproduced form Making Sense of the English Housing Statistics) compares the numberof EPC certificates lodged for new domestic properties (new build, conversions and change of use to domestic) with MHCLG Table 120 net new additions (new supply) outturns across the most recent 2018-23 period.

It indicates on an annual average basis that net supply was 0.98 below the reported number of EPCs granted on average across that period (although, that result was after a retrospective census adjustment was made for the 2018-21 new supply figures; the new supply figures also exclude demolitions).

Applying that 0.98 coefficient to the reported 232,473 new dwelling EPCs reported lodged during 2023-24, suggests a 2023-24 new net supply figure of about 227,000 dwellings, continuing a recent downward trend undoubtedly related to the recent housing market downturn amid wider economic uncertainty. 

Given that the new government was elected in July 2024, its target will need to be measured against 2024-29 financial year outcomes. We won’t have access – as was explained above – to accurate official new build completion and new supply outcome data, starting with 2024-25, until November 2026.

What can be predicted, however, as generally accepted both within and without government, is that annual new supply outcomes will seriously undershoot 300,000 dwellings until at least April 2027, resulting in an accumulating shortfall backlog against the total 1.5m delivery target.  

The projections reported below are based on MHCLG Table 213 housing starts data rolled forward two years to predict completions.

MHCLG new housebuilding and other indicator of new supply series source data, as customised in Tables 5A and 5B,  strongly suggests that the recent downward new supply trend reported above will not be reversed during the early 2024-26 period of the Starmer government.

Using that MHCLG data, Table 5A reports that 481,240 new build dwellings were started between 2021-24, an annual average of 160,400.

The key shortcoming of the MHCLG new housebuilding series is that it undercounts housing start and completion activity (primarily because of incomplete and fragmented building control source data)

The average difference between Table 213 reported completion totals and the later reported Table 120 net new supply across the 2018-23 period was 24%, as Annex Table Seven shows.

To compensate for that undercount bias, an adjustment multiplier of 1.24 was applied to the raw starts and completion data reported in Tables 5A and 5B to produce start and completion figures adjusted accordingly.

An adjustment coefficient of 1.415 was also applied on the raw Table 213 start and completion data, taking account of the average 41.5% annual 2018-23 disparity that Annex Table Seven reports between table 213 completions and table 120 new supply.

The final column of Table 5B reports projected future new net supply figures for 2024-26, adjusted accordingly.

Such rule of thumb projections are inherently tentative and indicative. Although yesterday starts are tomorrow’s completions, starts data provide a forward but imperfect indicator of future completions: they are subject to cyclical fluctuation related to the external economic and market environment and to funding programme profiles and associated delays.

In short, although there is no way of knowing precisely when reported starts will be converted into conversions, previous start levels provide a future indication of future completions around two years ahead, notwithstanding uncertainty over their precise phasing into particular financial years.

On that basis, Table 5B projects a 2024-25 and 2025-26 net new supply outturn of about 244,000 and 191,000 dwellings, respectively: a net new supply total of about 435,000 dwellings: an annual average approaching 220,000.

If so, this would generate a cumulative delivery shortfall by April 2026 of about 160,000 dwellings relative to the 300,000 annual target (2 *300,000) – (2*220,000) and the 1.5m delivery target.

Future 2024-26 private start prospects

The preceding sub-section projected total public and private 2024-26 (financial year) new build completions and new supply using adjusted MHCLG Table 213 new housebuilding start 2022-24 data.

We now turn to consider the prospects for unreported 2024-26 private starts activity that could then be expected to translate into post 2026 completions.

Future private speculative supply can be expected to prove sensitive to future market prospects as interpreted by housebuilder suppliers. These, in turn, are likely to be moulded by wider economic conditions and expectations, including interest rate movements.

Given the subdued nature of the private housing market in 2024 and the expected continuing impact of high (albeit hopefully their further softening after the July 2024 0.25% base rate cut) interest rates, few strong current grounds exist from a micro-economic standpoint that 2024-2026 start totals will materially increase from recent 2022-24 levels.

Recent omens have been unpromising. Barratt, example, in July 2024 announced a seven per cut in planned starts for the coming year into 2025 that can be expected to translate into future 2026 and 2027 completions. 

Research conducted earlier in the year by Savills included a chart that indicated – assuming no increase in government housing support (or other changes in policy and economic environment) – that annual (not adjusted as above) new build completions would not break through 160,000 throughout the remainder of this decade, which could mean that annual net new supply would undershoot 200,000, let alone reach 300,000 dwellings (less than 1m rather than 1.5m across the 2024-29 period).

Since then, however, the July 2024 election of the new Labour government committed to “build rather than block” has altered the planning policy environment.

The planning reforms announced by Angela Rayner – the incoming Housing and Communities Secretary – to parliament on the 30 July demonstrated the new government’s intent to remove blockages connected to local Nimbyism and other planning-related obstacles to new housebuilding and economically needed infrastructure and their linkage to its overarching growth agenda.

Nevertheless, the delivery shortfall projected to accumulate during 2024-26 means that for the 1.5m target to be achieved, new supply would have to substantially exceed 300,000 during the 2027-30 period.

And planning reform by itself, while necessary, will not be sufficient by itself to cause the current speculative private market-led system to deliver future housing volumes on the scale required.

Setting local delivery targets consistent with an annual supply level of 370,000 is not the same as securing their actual delivery on the ground.

Achieving such an unprecedented and sustained level requires not only sufficient planning permissions but crucially their implementation by profit-maximising private developers. It is they, not councils or housing associations, that primarily build dwellings at scale.

Their current business model, as the Letwin reports commissioned and published by the previous government so clearly showed, requires them to rather build and release dwellings for sale in step with that imperative, not government targets. Planning reform, as proposed, will not change that.

Another necessary condition, therefore, for the attainment of the 1.5m delivery target is reform of the current speculative private housing model in combination with supportive public policy changes.

Labour hitherto, however, has been quiet on the need for such reform and seems rather to treat private housebuilders as allied stakeholders and to rely on them to deliver increased supply at levels and timescales consistent with its 1.5m target.

The associated implication is that the new government is banking on or hoping for a house price recovery – led by falling interest rates amid recovered confidence that an era of prosperity and growth is round the corner – will induce private developers to build on such scale into a rising market.

Such a prospect on current indications to say the least seems optimistic on macro-economic grounds.

The Office of Budget Responsibility (OBR) in its March 2024 Economic and Fiscal Outlook (table 1.17: detailed forecast tables: economy) forecast that UK annual net additions on back of an in-house econometric model (predicated on assumed relationships between construction activity, past housing starts rolled forward on a two year moving average as completions, housing market turnover rates, and expected interest rate movements) would annually stagnate in the 235,100 to 244,800 range between April 2024 and March 2028, which would suggest annual net additions in England falling somewhere in the 211,000 to 225,000 dwelling range throughout that period.

That forecast no doubt will be revised this autumn to reflect the changed policy environment after the July election, but the UKs economic fundamentals taken a whole have not changed materially since save for the interest rate that month, which, however, was largely anticipated.

Planning reform will take time to work through and to overcome the opposition and reluctance of some local councils. Even if an increased volume of planning permissions did come on stream, macro-economic conditions and housebuilder profit prospects would have to be rosy enough to persuade developers to translate such permissions into starts on the ground on the promise that they could be sold speculatively in line with their expected 20% or thereabouts profit margins.

Even then, an uplift to 180,000 to 200,000 private speculative starts for completion by 2029 – exceeding levels fleetingly achieved (under 180,000) during the Lawson late eighties boom and at a lower level during the late New Labour period (around 165,000) before the Great Financial Crash – would seem a more realistic but still stretching and unlikely optimistic scenario as such a level has not been achieved since the late sixties.

Previous housing booms were accompanied by worsening affordability and access problems for potential first-time buyers, tightening further the English Housing Double Bind.

The recent downturn resulted in the haemorrhage of skilled labour from the construction industry presaging in the event of a future upturn future labour and material bottlenecks with consequent impacts on supply delivery, build costs and house prices, as well as possibly on general inflation, of a magnitude that could nip any such recovery in the bud, or, even reverse it.

A Bartlett professor and expert in this area, Noble Francis, has cautioned, in that light, that “skills shortages will be the biggest constraint to government’s ambitions of 1.5 million homes in this five-year parliament, the £700-775 billion infrastructure pipeline and the Net Zero transition (both the decarbonisation of the energy network and the energy-efficient retrofitting of the existing housing and non-housing stock)”.

Indeed, back in 2018, the final Letwin Report concluded (para 1.11)  “ that the only realistic method of filling the gap in the number of bricklayers required to raise annual production of new homes from about 220,000 to about 300,000 in the near[1]term, was for the Government and major house builders to work together on a five year “flash” programme of on-the-job training”. As Francis and other have pointed out the problem has worsened since then and there has been no concerted efforts to address it.

Another necessary but not sufficient condition for the 1.5m delivery target to be met thus therefore would be for the government in partnership with the industry to build up construction industry and its domestic skill base as a key component of its economic ‘mission’, which may also need to be supplemented by skilled worker migrant visa schemes.

Future 2024-26 public start prospects

Angela Rayner in her 31 July parliamentary statement also indicated “a once in a generation boost” to affordable, especially social rent housing.

That also won’t translate into delivery outcomes any time soon. On the contrary, a downtick in new affordable supply annual starts over the 2023-25 financial year period to an average 50,000 dwellings or less can be expected, translating into a similar level of affordable completions during 2025-27.

Affordable starts for the April 2018-23 period by sub-tenure (when known) reported in MHCLG Table 1011S, provide an indication of future short-term gross affordable completion levels.

Although about 71,800 affordable starts were recorded in 2022-23, the most recent data on affordable starts and completed funded by Homes England and the GLA, summarised in Table 3B, shows that in total such starts fell from around 55,000 dwellings in 2022-23 to about 31,000  in 2023-24. In London they plummeted even more dramatically by about 90% to about 2,300.

The precise reasons for this sudden and apparently calamitous drop are not totally clear or, at least, accepted by competing stakeholders, but programme profile and approval issues, market conditions and costs, and the impact of post Grenfell and other regulatory requirements on housing association capacity not only to build new affordable dwellings but to purchase such dwellings subject to Section 106 affordable housing agreements, all seem to have played a part.

Projecting such start activity into future completions, the 55,100 affordable starts reported by Homes England and the GLA for 2022-23 accounted for about three quarters of the 71,800 total affordable that the MHCLG later reported in Table 1011S.

Conducting another rough rule of thumb exercise, replicating that relationship would suggest about 42,000 affordable starts in 2023-24 based on the above reported Homes England and GLA data. The outcome figure that the MHCLG will report in December 2024 could be lower or higher than that, but the omens overall are to the downside.

Such a level in practice would require affordable starts to increase to about 58,000 in 2024-25 to get to an 2023-25 annual average of 50,000 dwellings, projecting a similar completions level into 2026-28.

Future affordable supply prospects beyond that are uncertain given its dependence on private cross-subsidy (less is available in a subdued private market), the future impact direction of building and labour costs, and the future ability of Private Registered Providers (housing associations) to use their reserves to finance new building or even to purchase S106 properties.

In such an environment, substantially increased grant funding would need to be made available to secure a future step change in affordable supply.

But Angela’s Rayner’s 30th July parliamentary statement on that score was vague, in terms of whether the forthcoming Comprehensive Spending Review (CSR) housing settlement would involve substantial additional resources in contrast a refocus of resources towards Social Rent (SR) provision, direct recycling of Right-to-Buy receipts into council direct provision, better targeting of available resources to high need areas, and efficiencies such as longer-term and more certain funding and rent settlements.   

Increased ADP resourcing before it translated into new build completions would generally involve a time lag of least two years, although increased funding for acquisitions could have a quicker effect. 

In short, therefore, any real upward step change in affordable housing supply will be contingent on both increases in public housing investment and, as discussed above, a resurgence in economic and private housing market conditions sufficient to secure increased private speculative supply (to provide increased cross subsidy).

3          Concluding comments

A 2024-27 cumulative new supply total of 750,000 (annual average 250,000) dwelling, on the evidence of the preceding section, is unlikely: if the preceding section’s 450,000 dwelling supply total projection proved reasonably accurate, new supply would need to increase to 300,000 by 2026-27.

Housing start activity would then have had to gear up to that level in calendar year 2025. That, in turn, presupposes a rapid and substantive economic and housing market turnaround next year impacting upon private start and completion levels following a generous autumn 2024 CSR housing public expenditure settlement that translated into a quick substantive step up in public start activity – all quite heroic assumptions.

More likely is a 2024-27 new supply total hovering around 700,000 dwellings. Even that would require net supply to recover to 250,000 dwellings during 2026-27, which on the evidence reported in in the preceding section also appears on the optimistic side although possible.

That would mean during the last two years of this parliament that annual new supply would need to exceed 375,000 dwellings – the level required if new supply reached 300,000 in 2026-27: an unprecedented post war level.

New build completions exceeded 350,000 dwellings in 1968, but because of accompanying large scale slum clearance demolition and redevelopment activity then, net supply was lower rather than higher than new build totals, as it was for much of post war period until the eighties.

Starmer and Labour’s target seemed to presuppose that several New Towns and urban extensions, at least in substantial part, are planned, land acquired, prepared, approved, funded and delivering dwellings by 2029, amid and alongside a wider step increase in both private speculative market and public affordable provision.

Most informed commentators, rule out the New Towns Programme delivering completions this parliament and caution that most existing identified new town/urban extensions/garden communities are at an early planning stage and that historically such settlements have been prone to a slow annual delivery rate not much better than the average for speculative private developments, as was deplored by Letwin in his .

That ‘spades in the ground’ from such sources cannot be expected on any scale during this parliament has been recently recognised by the incoming housing minister.   

The relationship between the revised annual aggregated 370,000 local planning dwelling target and the future contribution to be made by such existing schemes and the proposed New Towns is therefore unclear, which is likely to add to uncertainty and associated local opposition.  

Achieving, therefore, the delivery of more than 350,000 dwellings from 2027 onwards, on the face of it, seems unrealistic, if not fanciful, pure and simple, at least in the absence of wider reform and integration of public and private delivery systems.

A focused, co-ordinated, streamlined and effective public-private partnership approach to housing delivery on lines suggested by the 2017 Letwin reports, yet going further, in line with an overarching and primary political commitment to achieve a step change in housing, especially affordable, delivery accounting for a much larger than the current 27% share of total delivery is a clear necessary overarching condition. This the second post of this series will concentrate on.

To be met, it would also require sustained political overarching focus and institutional coordination and drive of a nature unprecedented and unexperienced for decades.

Public pump-priming infrastructure investment mid-decade rather than end-decade, enabled by a firm but flexible, rather than ironclad, interpretation of fiscal rules, focused on sustainable growth and best use of public resources over the medium term rather than mechanical and rigid calculations of future debt levels, would also provide another necessary but not sufficient condition.

In the absence of such reform, the most likely but uncertain and still optimistic scenario is that a muted macro-economic recovery and changes to the government funded Approved Development Programme involving greater long-term funding certainty and a refocus towards Social Rent will be associated with new supply levels reaching the 250,000 to 300,000 range by 2027-29.

Share this:

  • Click to share on X (Opens in new window) X
  • Click to share on Facebook (Opens in new window) Facebook
  • Click to print (Opens in new window) Print
  • Click to email a link to a friend (Opens in new window) Email
  • Click to share on WhatsApp (Opens in new window) WhatsApp
  • Click to share on LinkedIn (Opens in new window) LinkedIn

Filed Under: Housing Tagged With: housing supply, planning

Making Sense of the English Housing Statistics

3rd August 2024 by newtjoh

Introduction

This extended post publication signposts readers to the official sources of key housing statistics predominately collated and reported by the Ministry of Housing, Communities and Local Government (MHCLG), with some wider reference to UK-wide statistics that the Office of National Statistics (ONS) reports, as well as to other sources, where appropriate and illuminating, most notably the 2022-23 English Housing Survey (EHS).  

It is a comprehensive recast, extension and update on Making Sense of the Housing Supply Statistics published last year on this website and now includes six sections, each provided with a commentary provided populated with links to relevant tables reporting the source data and to a summary identifying possible policy implications.

Sections One to Four review the four main relevant source housing supply time series published by the MHCLG: the housing supply, net additional dwellings (net new supply), the dwelling stock, the affordable housing, and the often-neglected social lettings series.

These sections focus on the most recently published MHCLG affordable housing (December 2023), social letting statistical series (January 2024), and the dwelling stock estimates series (May 2024).

Section Five covers the MHCLG indicators of new supply series (termed in this post new housebuilding estimates and new indicators of supply and final tenure estimate series for reasons it explains).    

Section Six focuses on house prices, private rentals, and affordability data.

The aim, first, is to provide a user-friendly guide to the availability of such statistics and their most appropriate application and use depending upon the purpose of the enquiry, without being overwhelmed by detail.

Second, to provide structured and evidence-based context for independent policy analysis across the new policy environment that has been ushered-in by the 2024 general election.

Links to the source data mean that readers can always access it to assist user-led interpretation and on-going reference and review.  

They are also provided to interactive dashboards published by the MHCLG within their respective series and to the House of Commons Library that will allow readers to access data (sometimes incomplete) at an individual local authority level with a touch of a mouse

The post includes some new initiatives, including:

  1. Table-1A collated by this website from different MHCLG sources provides a time series for the 2011-23 period providing an average per 1000 dwellings new supply figure, by region. This was felt to be important given the wide variance in dwelling supply that exists between local authorities (LAs) often unrelated to local demand or need;  
  • To partially relieve the lack of a definitive official data tenure-based net new supply source, at least at a stock rather than flow level, Annex Table Three, itself derived from MHCLG dwelling estimates series table 104, breaks down annual net changes to dwelling stock to sub-tenure, including renting from local authorities;
  • Table 3A is designed take account of, and to statistically adjust for, the shift away from Social rent (SR) provision towards government Affordable Rent (AR) to provide more like-for-like decadal supply comparisons;
  • Tables 5A and 5B  and accompanying commentary projects 2024-27 new build completion and supply outcomes with reference to the new government’s 1.5m delivery target.     

Some housekeeping points: all data and commentary refer to England unless otherwise stated.

The UK Housing Review provides information at the Great Britain and at an individual country level for Wales and Scotland.

More detailed information for London can be found in the Greater London Authority’s  Housing in London publication.  

The labels (Private) Registered Provider (RP), more commonly known as Housing associations (HAs) are used interchangeably. Section Three provides more definitional information, including the distinction between ‘social rented’ dwellings and dwellings let at Social Rents).

Many table references will include references to the Department of Levelling Up, Housing and Communities when compiled prior to the 2024 general election and the subsequent departmental name change.

Numbers, depending on the nature of the data, have been rounded to nearest thousand or million as appropriate and percentages to the nearest single data when prefixed “about” or to the nearest single figure, percentages normally to one decimal point.

The direction of travel or trend is often more illuminating that a falsely precise figure subject to sampling or other methodological issues, to incomplete and patchy returns subject to later revision. Round figures also sometimes stick in the memory more. 

Decadal averages are employed in the tables as much as possible to illuminate longer term trends and five-year averages for shorter term ones.

Annual and even more so quarterly figures should not be considered in isolation, given their proclivity to funding programme cycles and other contingent factors.                                                                                                   

Comments and observations are welcomed to asocialdemocraticfuture@outlook.com.

1          Housing supply: net additional dwellings (net new supply) series

The net new supply series is presented by the MHCLG as the primary and most comprehensive available new housing supply metric for England. This is for two primary reasons.

First, it includes changes to the stock other than from new build completions, which can be higher or lower than net new supply. The measure thus records the complete flow of net additions or losses that add or subtract from the total dwelling stock.

The large-scale post war slum clearance and redevelopment demolitions that marked the 1961 to the 1980 period meant that net new supply lagged new build completion totals, when, across recent decades, gains to the stock from net conversions and from net changes in use have tended to outpace losses from demolitions, resulting from annual net new supply exceeding new build completion totals.

Second, as the MHCLG technical notes that accompany the series set out, its method of compilation is more comprehensive and accurate.

LAs outside London are expected to record all the changes to the housing stock within their areas over the previous financial year, before inputting them into what is officially termed a standardised housing flows reconciliation (HFR) form for submission no later than the subsequent September.

The Greater London Authority (GLA) collates similar information from the London boroughs.

Each LA, therefore, has up to five months from the end of the financial year to submit their annual HFR return. This compares to the much shorter six-week submission period connected with the building control based quarterly new housebuilding series, described in Section Five.  

By having more time to reconcile diverse potential sources of completed new build activity, including from council tax, building control and other records, as well as site visits, LAs can consequently compile a more complete and comprehensive count of additions to their local stocks.

Each November successive to the preceding financial year, the MHCLG publishes a housing supply (net additional dwellings) statistical release and an updated set of accompanying live tables that together describe changes to the net supply position.

The latest such release published in November 2023 reported net supply change between 1 April 2022 and 31 March 2023.

It also utilised 2021 census data to rebase the total annual net supply figures to the change in the total dwelling stock by enumerated by the 2011 and 2021 censuses.

58,860 dwellings additional to the aggregated net supply figures previously reported by the series, as identified in the 2021 census, were added to the stock.

This was done by making a constant 5,880 to the annual 2012-21 net additions (supply) figures, much smaller than the annual 16,190 census adjustment uplift made across the previous 2002-11 period.

The latest 2021 census dwelling count now provides the baseline for succeeding net supply and dwelling stock estimates (see next section) until the next adjustment is made to both series to reflect the future 2031 census total dwelling count.

The components of total net supply, including new build completions, however, are not census-adjusted and remain based on historic annual net supply LA statistical returns (see Annex Table One).

Figures reported for 2022-23 figures are provisional, subject to revisions to be reported in the next November 2024 release.

Revised data from 27 LAs resulted in an increase of 1,646 net additional dwellings recorded for 2021-22.

Live Table 118 of this net supply series reports total annual net additions, by region, since 2000-1, taking account of successive census decadal adjustments, according to its components since April 2006

Table 120  also breaks down the different annual components of net supply since April 2006, including:

  • new build completions;
  • conversions from houses to flats;
  • net changes to the dwelling stock resulting from gains or losses,
  • from 2015-16 onwards, changes in use resulting from permitted development rights have been separately catalogued
  • any retrospective census adjustment, when applicable and known.

Demolitions are then subtracted to provide the annual total net new additions (new supply) figure.

The immediate short story conveyed by Annex Table One is that annual net additions (new supply) steadily rose from 146,700 in 2001-02 to 223,500 in 2007-2008.

The impact of the Great or Global Financial Recession (GFC) then drove a collapse to an ultimate new supply floor of 130,600 in 2012-13.

Subsequently annual new supply steadily recovered to reach a peak of 248,600 in 2019-20.

Although it has subsequently dropped back, during the most recent 2018-23 period, annual new supply averaged 236,600 dwellings during that period, the highest five-year average recorded since the series began.

It should, however, be borne in mind that in England, the population grew by almost 3.5 million (6.6%) between the 2011 and 2021 censuses to 56,489,800 people, increasing the pressure on the housing stock.

212,600 new builds were completed in 2022-23, accounting for about 90% of the 234,400 total net supply increase reported for that latest year.

Net change in use attributable to permitted development rights (PDRs, which allow change of planning use without formal planning permission) accounted for 18,900 of the 37,900 total change in use total in 2016-17.

In the latest 2022-23 year such PDRs accounted for 9,500 (7,900 reflecting changes in office to residential use) of the total 2022-23 net change to the residential use 22,800 dwelling total (see columns C and D, Annex Table One).

Demolitions, which are subtracted from the net additions total, have fallen progressively and continuously from 22,300 in 2006-2007 to 5,500 in 2022-23.

Table 1  confirms that about 90% of new supply during the last two 2021-23 years are accounted for by new builds, compared to about 82% in 2016-17, when numbers in net changes in use, including those resulting from the newly liberalised permitted development rights peaked, giving rise to concern about the size and quality of some of the additional residential dwellings provided through that route.

Even though new build completions and total new supply may have reached a peak in 2018-20, the table shows that they still fell well short of the prevailing 300,000 new supply target.

It also demonstrates the proneness of net new supply and its components to fluctuate in a lagged response to wider macro-economic and housing market conditions.

Net supply in 2012-13 (reflecting the collapse of private speculative activity during and in the wake of the 2008-10 global financial recession) was barely half of the recovered 2018-20 level.

MHCLG Tables 122 and 123 reports total net additional supply by LA district and their component flows, respectively, since 2001-2.

MHCLG Table 124 reports annual changes in the flows of communal non-self-contained accommodation by LA district.

These changes are separate to and are not included in the other tables or the net supply figures, which only records self-contained accommodation in accord with the census definition.

The House of Commons library has produced a very useful online housing supply dashboard in which users at a touch of their mouse can access and print net new supply data for individual LAs covering the most recent ten year reported, or as  users require.

Alternatively, the MHCLG’s own interactive dashboard can be consulted.

Although it is less print-friendly, it does report net new additions (supply) broken down into its components at a local LA level, as well as at regional and national level, on a per 1,000 dwellings basis, for individual years.

It does not, however, allow users to derive average per 1,000 dwelling figures over an extended period, in contrast to year-to-year comparisons.

These can mislead due to the frequent lumpiness of new supply at the local level, connected, for instance, to a completion of a large development in a particular year.

Examples taken from two regions, the East Midlands and London, demonstrate that clearly.

The MHCLG net supply interactive dashboard reports that net new supply per 1,000 dwellings across the Nottingham City Council area in 2022-23 was 14.3 (reported here to nearest decimal point): much higher than the 4.9 reported for 2020-21 and nearly six times its 2011-21 decadal average figure of 2.4.

Net new supply per 1,000 dwellings across the East Lindsey council area (second largest by area for England; mainly rural but including market and coastal towns, such as Louth and Skegness) in 2022-23 was six, nearly than five times less than its 2011-21 average of 30.2.

In London, Barking and Dagenham, net new supply per 1,000 dwellings in 2022-23 was 15.9 compared to 4.7 as recently as 2017-18.

Table-1A collated by this website from different MHCLG sources provides a time series for the 2011-23 period providing an average per 1000 dwellings new supply figure, by region.

It reports the 2011-21 decadal average and the most recent half decadal 2018-23 average, as well as individual years 2011-23, all by region.

The data shows both some intertemporal (between individual years) and spatial (between regions) variation, although less than one would expect if new supply performance was more closely aligned to relative demand.

Taking the half decadal 2018-23 average as the benchmark, London reported the highest 10.9 average per 1,000 average and the North East the lowest, 7.1, within an overall England average of 9.6.  

Such region-wide averages mask much larger differences occurring within them.

Whilst the incompleteness of data coverage reported at that local level should be borne in mind, the range of performance that can be displayed between even neighbouring authorities is striking, noting that due to the often lumpiness of new supply at a local level, decadal or half decadal rather than individual year figures should be considered, as was explained above.

The 2011-21 decadal average for East Lindsey, for example, was 30.2, when for North Kesteven it was 10.3. In Lincoln, it was 5.6.  

In London, the 2011-21 decadal average for Richmond (in London) was 3.6 while in neighbouring Hounslow it was 10.4.

The decadal average in Tower Hamlets was 22.7 compared to 13.4 across the river in Southwark.

There is no necessary relationship between such outcomes and local housing need and demand.

Summary

Since April 2006 the net supply series identifies and measures the different components of net new supply, including new build completions.

It consequently provides the primary and most comprehensive and accurate available statistical record of the different components of new supply at both national and LA levels, consistent with the census definition of a self-contained dwelling.

The series, however, is only published annually in November for the preceding financial year; given that and because it does not cover dwelling starts, it is not forward-looking.

Accordingly, to obtain a more timely but imperfect indicator of new build completions for the year preceding November publication of this series and of future activity, the demonstratable inaccurate new housebuilding series must be consulted (see Section Five, new housebuilding and new indicators of supply section for a full discussion).

The net supply series also does not break down the reported net supply total by tenure, a significant omission insofar that gross reported new affordable supply greatly exceeds net new affordable supply – as the affordable housing series sub-section in Section Three will later show and discuss.

However, the next and successive sections will also identify sources that can be used to overcome at least partially that and related shortcomings.   

2          The dwelling stock series

The dwelling stock series reports total stock estimates back to 1801, when the first census took place, and, from 1961 onwards, also its tenure breakdown.

This series is published each year in May to include data for the past but one 1 April to 31 March period: the May 2024 statistical release (see below) and accompanying tables accordingly reports dwelling stock data for 2022-23.

Until April 2000, the annual dwelling stock estimates provided the source of the annual net additions figure. That, hitherto, had not been separately produced as a standalone series.

From 2000-01 onwards, the annual total dwelling stock estimate has been equal to the previous year’s dwelling stock estimate plus the latest annual net new supply of housing figure.

The total dwelling estimate is broken down (disaggregated) into owner-occupied and private rented sector tenures and into ‘rented from’ local authority (LA) housing and housing association (HA) sub-tenures (together, social housing).

This is done using periodic survey data mainly for the owner occupied and privately rented sector split, including the English Housing Survey (EHS), Labour Force Survey (LFS), and the Local Authority Housing Statistics (LAHS)  and the Statistical Data Return (Regulator of Social Housing) returns for the social housing sub-tenure split.

The private housing stock is not split into owner-occupied and private rented sector at the local authority district level, however.

Dwellings are defined in line with the census definition: a self-contained unit of accommodation where all the rooms (including kitchen, bathroom, and toilet) in a household’s accommodation are behind a single door that only that household can use.

A dwelling therefore can consist of one self-contained household space or two or more non-self-contained household spaces at the same address.

Ancillary dwellings (for example, ‘granny annexes’) are included provided they are self-contained, pay separate council tax from the main residence, do not share access with the main residence (for example, through a shared hallway) and that there are no conditional restrictions on occupancy.

Communal establishments providing managed residential accommodation, are not counted. These include university and college student, hospital staff accommodation, hostels/homes, hotels/holiday complexes, defence establishments (not married quarters) and prisons.

But purpose-built (separate) homes (for example, self-contained flats clustered into units with four to six bedrooms for students) are included in the dwelling estimates, with each such self-contained unit counted as a dwelling.

Non-permanent (or ‘temporary’) dwellings are included if they are the occupant’s main residence and when council tax is payable on them as a main residence.

Such dwellings can include caravans, mobile homes, converted railway carriages and houseboats.

Permanent gypsy and traveller pitches are also be counted as dwellings, if they are, or likely to become, the occupants’ main residence.

The series technical notes provide more background information.

Shared ownership dwellings are currently counted as owner occupied within the dwelling stock series.

The English Housing Survey (EHS) estimated back in 2019–2020 that there were around 202,000 households living in shared ownership properties in England (could be closer to 250,000 in 2022-23), representing approximately one per cent of homeowners and less than one per cent of all households.

The dwelling stock estimates series also does not split PRS properties into sub-tenures, including to buy-to-let (BTL) and build to rent (BTR), nor does the EHS for households, although both sub-tenures are important segments of the housing system.

Table 56 of the UK Housing Review reported that in 2022 there were over two million BTL mortgages outstanding in the UK compared to 836,000 in 2006 and less than 30,000 in 1998, suggesting that is now home to around two million households and to around 45% of private renters: a momentous economic and social change that deserves some attention within the official statistics and wider analysis.

The BTR sub tenure comprises homes built for private market rental. Industry sources suggest that there are around 100,000 BTR dwellings, most of which are concentrated in London and other metropolitan centres.  

Dwellings classified as ‘other public’ include dwellings owned by government departments, such as Ministry of Justice and of Defence. These can be vacant awaiting sale or redevelopment.

As Section 1 explained, both the dwelling and net new supply series are subject to a decadal retrospective and a new baseline census adjustment, usually applied in the year following each successive census.

In that light, the technical notes (scheduled revisions) of the May 2022 statistical release reporting for the year and period ending 31 March 2021 advised that a level 5,880 dwelling upward adjustment to the previous reported annual dwelling estimates for the decadal 2011 to 2021 period had been made, reflecting the 58,880 self-contained dwellings enumerated by the 2021 census that were additional to (on top of) what the new supply series had had previously reported for that decadal period, thus mirroring the adjustment made to that series.

In short, the adjustment ensured that the total dwelling stock estimate for 31 March 2021 equated to the 2021 census total dwelling count.

The end March 2023 figures were reported in the May 2024 statistical release.

This reported that there were 25.4m dwellings in England, as of 31 March 2023, an increase of 234,400 dwellings or 0.93% on the previous year (an increase corresponding to that reported in November 2023 net new supply (additions) series, (see Annex Table One).

Other headline results (reported to nearest 100,000; for example, LA stock figures reported as 1.6 million below were reported as 1,571,000, in Table 100) were:

  • 16.3m dwellings were owner-occupied dwellings, an increase of 176,000 dwellings on the previous year (64.1% of total dwellings compared to its 69.5% peak in 2001);
  • 4.9m dwellings were private rented dwellings (19.4% compared to its recent peak of 20.3% in 2016) an increase of 35,000 dwellings on the previous year;
  • 4.1m dwellings (16.3%) were social and affordable rented dwellings (combined Private Registered Providers (RP) and Local Authorities figure), an increase of 25,000 dwellings on the previous year, of which 2.6m. were rented from Private Registered Providers (also known as Housing Associations) and 1.6m. dwellings were rented from Local Authorities.  
  • 31,000 dwellings (0.1% of total) were other public sector dwellings, a decrease of 2,000 dwellings on the previous year;
  • 699,126 vacant dwellings (2.8% of total) were recorded in England on 2 October 2023, an increase of 22,822 or 3.4% from 676,304 on 3 October 2022;
  • 261,474 dwellings were long-term vacant dwellings in England on 2 October 2023 (one per cent of total), an increase of 13,325 or 5.4% from 248,149 on 3 October 2022.
  • England had a dwelling density of 1.95 dwellings per hectare as of 31 March 2023

All figures are rounded (as above), are provisional and are subject to revision. They are estimates rather than precisely accurate, as are most official statistics.

The latest English Housing Survey (EHS) provides information on tenure at the household rather than dwelling level, but, to all intents and purposes, mirror the dwelling estimates.

Owner occupation remained the largest tenure group in England (65% of households) in 2022-23, the social rented sector the smallest (16%) including 10% or 2.5 million households rented from housing associations, and 6% or 1.5 million households from local authorities, while the private rented sector has hovered around a similar proportion (19%) since 2013-14.

Unsurprisingly there were regional variations:

  • 31% of households in London were private renters, compared to 17% in the rest of England;
  •  21% of London households were social renters, compared to 16% in the rest of England, with the 10% proportion renting from a local authority much higher than across England generally (6% as above);
  • 49% of London households were owner occupiers compared to the 68% who were across the rest of England. 

MHCLG live Table 100 reports, from April 2009 onwards, the total dwelling estimates and their tenure breakdown down to LA level (grouped according to type of authority, not to region).

Owner occupied and private rented sectors reported at the LA level are subsumed into one private sector category. At the national level LA and PR sub-tenures are separately reported.

MHCLG Table 104 provides a historical annual dwelling stock series, dating back to 1801, with a tenure breakdown first provided in the census year 1961 and then annually from 1969 onwards.

The short story it tells is that in 1961 the LA and the private rented (PR) stock when combined exceeded the then c6.1m dwelling owner-occupied stock.

The LA stock continued to climb to its 5.2m peak in 1980, after which it plummeted to its current trough level of less than 1.6m. compared to about 2.6m RP owned dwellings, when, until 2008 there were more LA-owned than RP dwellings.

The PRS stock slid from 4.4m in 1961 to 1.6m in 1986, before subsequently recovering robustly to its current level of about 4.9m.

The owner-occupied dwelling stock progressively increased in total numbers throughout the period to its current c.16.3m dwellings, notwithstanding that its percentage tenure share fell from its recorded high of nearly 70% (69.5%) in 2001-2002 (EHS figures reported nearly 71%) to 64.5% in 2010-11, where it has broadly remained since.

Annex Table Two derived from MHCLG live Table 104 reports the total stock dwelling estimates, for each year since April 1991 up to 31 March 2023, by tenure and sub tenure.

MHCLG Table 109 provides a summary breakdown for the same post April 1991 period, by tenure and region.

Table 2 provides summary data for dwelling stock, by tenure and sub-tenure, as percentage of total for the census decadal years 2001, 2011, 2021, and then for 2023.

It reports that the owner-occupied tenure share fell from nearly 70% in 2011 to about 64% in 2021, while the percentage of the total dwelling stock taken by the private rented sector (PRS) nearly doubled as a percentage between 31 March 2001 from about 10% about 19% in 2023, with the share taken by LA rented more than halving from about 13% to about six per cent during the same period, with the RP tenure share rising to about 10%.

Since 2001, the combined LA and HA total (labelled social and affordable rented in the table) fell from about 20% to about 16%.

The EHS reports that since 2013-14 outright owners have outnumbered mortgagors 35% of households reported in 2022-23 as owning outright compared to 29% as mortgagors in 2022-23, a product of an aging population leading to larger numbers of people paying off their mortgages and becoming outright owners, as well as probably of an increased unquantified number of cash purchasers.  

Table 2A reproduces Table 3 of the MHCLG 2024 dwelling stock statistical release, which presented and reported an increase in the combined LA and RP tenure stock (labelled as ‘social and affordable rented’) of c25,000 dwellings in 2022-23.

Since April 2009, according to that official table, their combined total has increased on average annually by about 14,000 dwellings (disregarding dwellings categorised as ‘other public sector’).

That table, however, made no split between Social Rented and Affordable Rent’ sub-tenures let up to 80% of market levels – a significant omission insofar that many commentators consider the affordable housing sub-tenure not to be ‘genuinely affordable’.

Annex Table Three, reports the annual change by numbers in the estimated dwelling stock for each year since April 1991 up to 31 March 2023, by tenure and sub tenure, withLA and RP figures split.

It reports a continuing decline in the LA rented stock, which since April 1991 has fallen by more than 2.3m dwellings, compared to an increase of around two million in the HA stock.

The primary driver for that outcome is the impact of Right-to-Buy (RTB), introduced as a new flagship social policy by Mrs Thatcher in 1979 and statutorily enacted in the 1980 Housing Act.

MHCLG Table 678 reports that during the 40-year period from the introduction of the Right-to-Buy (RTB), starting in 1981 and ending 2022, more than two million dwellings were sold to LA and RP tenants exercising their RTB, c93% of which were to sitting LA tenants.

Such annual combined RTB sales peaked at c84,000 in 2003-04, before collapsing to c.3,100 (mainly because of changes in discount and eligibility arrangements) in 2009-10, before rising to a more stable average of 13,200 dwellings across the 2013-22 period. 11,303 dwellings were sold to sitting tenants in 2022-23.

The fluctuating RTB stock losses, summarised in Table 2B, contributed to the results reported inAnnex Table Three.

These tables, when taken together, show that the LA lost nearly 100,000 dwellings annually during the eighties, reducing to 45,000, on average, during the nineties, and to 35,000 in the noughties, and further still to about 10,000 annually during 2010-20 and the most recent 2018-23 half decade.

Although the outflow from RTB has decelerated, since 1991 the LA net stock has still lost a net c2.3m dwellings.

During 2022-23, there were 11,200 RTBs in the LA sector, 4,600 RP sales to sitting tenants, a total of 15,800 sales to social housing (LA+RP) sitting tenants.

Summary and policy implications

The dwelling stock series is a core series calibrated to the past decadal census then to the new supply series until the next census.

It conveys more information than is generally recognised on tenure composition trends, derived from an additional range of sources, including the English Housing Survey.  

Annex Table Three, itself derived from series table 104, in contrast to Table 2A, breaksdown net changes to dwelling stock to sub-tenure, including renting from local authorities, confirming that it lost about a further 5,000 dwellings in 2022-23, despite an uptick in new builds and, by the standards of 1981-2006 at least, a relatively modest level of about 11,000 RTBs, and provides a good indicator, albeit measured at a lagged stock rather than flow level, of net changes in tenure composition.

The new Labour government is expected to trim RTB discounts but given its fiscal rules will forbid increases in net current expenditure that add to debt (in case, say, a revenue contribution to new council provision, financed by RTB proceeds), it will need to navigate a trade-off between future RTB volumes and receipts generated that could be recycled into new investment.  

That 35% of households reported in the 2022-23 EHS as owning outright compared to 29% as mortgagors in 2022-23, clearly has implications for economic and social policy beyond housing, insofar that it can be expected to reduce the effectiveness of interest rate changes on house prices and broader macro-economic outcomes, as well entrench generational inequalities.

More granular and assessable information of sub-tenures, including Build to Rent (BTR), and Buy to Let (BTL) would be helpful.

Quite clearly, however, the most pressing and important policy issue or implication is the growing concentration of poorer, younger people into the PRS, often poorer quality stock in locations offering limited economic opportunities.  

3          Affordable housing series

Introduction and definitions

The affordable housing series reports the gross annual new supply of additional affordable dwellings for rent or sale that is provided for specified eligible households whose needs are not met by the market.

Dwellings classified and recorded as affordable housing, according to the official definition, encompass a range of sub-tenures. These are defined briefly below.

Social Rent (SR) dwelling rents are set according to national guidelines involving the calculation of a ‘formula rent’ for each property based on its relative local market value, on relative local income levels, and on its size.

This is done with reference to a stated aim to ensure that “similar rents are charged for similar properties” that is not always realised in practice.

Dwellings let in accordance with such arrangements are termed Social Rent (with initial block capitals) dwellings in this post.

The MHCLG in its January 2024 MHCLG Social housing-lettings April-2022 to March-2023 (Tenancies) statistical release advised that the national median SR in 2023 was 47% of market rental levels, although that proportion can vary within and between areas and regions.

Another sub-tenure akin to SR, as explained here, is London Affordable Rent, calibrated to 2016 Social Rent levels, save that the annual rental increase allowed for SR lets was back then capped until April 2020 at Consumer Price Index (CPI) less one per cent (CPI-one per cent), but LAR rents could be updated annually by CPI inflation plus one per cent.

Since April 2020 CPI + one per cent been the base ‘social rent’ cap set for all SR and AR tenancies let by LA’s and RPs, as set out in this 2020 government statement, save where subject to an overarching ‘cost of living’ cap.

In this post, data on LAR delivery is subsumed within the SR category.

Affordable Rented (AR) housing was introduced in 2011 by the incoming Coalition government to be let by providers of social housing to eligible households at a rent of no more than 80% of the local market rent (including service charges, where applicable).

According to the above same MHCLG release, it was let at a median 71% of market rent levels in 2023-23.

Intermediate Rent (IR), according to official definitions, should not exceed 80% of the current market rate – although some exceptions to that rule may be included and recorded in the affordable series data.

SR + AR + IR is officially defined as ‘social rented’ or ‘low-cost rental’ housing (no capitals), and thus is wider in sub-tenure scope than the Social Rent (with capitals) sub-tenure, as defined above.

That can prove confusing, especially when SR and AR are not specifically differentiated in the data.

Accordingly, for the purposes of this post, what is officially defined as ‘social rented’, is generally described as Social Rent (SR) and Affordable Rent (AR) and Intermediate Rent (IR) combined, or as is applicable.  

Intermediate affordable housing are homes for sale and rent (not SR or AR) provided at a user cost above Social Rent levels but below market levels, subject to it remaining at an affordable price for future eligible households and/or to the recycling of expended subsidy into the support of alternative affordable housing provision.

Such housing can include shared ownership and other tenure forms where some equity is retained by the provider, as well as other low-cost homes provided either for sale or for intermediate rent.

In 2021-22, First Homes was created as a sub-tenure form intended to eventually account for at least 25% of all affordable housing units delivered through planning obligations but was embraced by LA’s generally with reluctance.

Its future following the 2024 General Election result is uncertain and it could possibly be replaced with an alternative government-sponsored home ownership product.  

The new Communities and Housing Secretary in her July 2024 announcement confirmed that LA’s would not be required to provide a prescribed proportion of affordable home ownership housing and emphasised a refocus on SR provision.

Dwellings purchased under the post-2013 Help-to-Buy programmes are not recorded as affordable housing, on the ground that purchaser access was not subject to an income qualification.

Social landlords of what is officially defined as affordable housing can be a local authority (LA) – letting dwellings generally known as council housing – or be a private registered provider (RP) registered with the Regulator of Social Housing (RSH).

Historically, only non-profit-making organisations, previously known as housing associations, and still sometimes referred to as such given that most private registered providers are HAs, (this post will also use the terms HA and RP interchangeably), could be registered as providers of social housing or as social housing landlords.

Since April 2010 profit-making organisations also have been able to register with the RSH.

RPs can now include:

  • organisations providing supported housing and care;
  • local authority subsidiary companies;
  • community groups seeking to develop new housing;
  • commercial developers setting up small subsidiaries to receive Section 106 affordable housing;
  • subsidiaries of investment companies and funds;
  • entities established by registered provider groups, either new parents for their group structures or new subsidiaries;
  • small charities, such as alms houses.

Dwellings provided by non-registered providers should not be counted as affordable housing. However, in practice, they sometimes are (they are, for instance, separately defined in MHCLG Table 1013, see below).

Affordable housing can be newly built, acquired, or result from a net gain secured through conversion or from a change in use.

The affordable housing seriesreport Gross totals that take no account of demolitions (representing a direct dwelling loss) or of sales of existing affordable dwellings overwhelmingly into owner occupation.

The series, therefore, does not report changes in annual net affordable supply: the net flow of stock gains minus losses across each sub-tenure – which can be positive or negative – nor its availability, as indicated by new lets.

Rather, it measures new affordable provision activity (predominantly of new build, but also including acquisitions and net gains or losses from conversions and from changes in use).

Such gross new provision of sub tenures therefore influences, but does not necessarily determine, either their net stock position – which Annex Table Three reported in the preceding section acting as a p[atrial corrective – or their letting supply availability, as Section Four will shortly show.

Affordable housing series data

Affordable starts and completions for the preceding financial year (2022-23) are published in the succeeding late November/early December (2023) alongside updated live tables, which are also subject to scheduled revisions each June/July.

MHCLG Table 1000 reports the most up-to-date summary estimates of affordable housing provided for the period since the series started in 1991-92 (primarily new build completions, but also acquisitions and net additions resulting from conversion or from change in use).

Henceforth affordable housing series terms ‘completions’ and ‘provided’ are used interchangeably, unless otherwise stated

MHCLG Table 1000C additionally breaks down that summary data to sub-tenure by type of scheme and funding. Table 1000S reports also affordable starts on a similar basis but – as across the series in cases where starts are reported – from 2015-16 onwards only.

MHCLG Tables 1008C and 1008S break down the total affordable completion and start information to region and LA district level, while Tables 1006 and 1007 do likewise for different defined sub-tenure types, reporting both starts and completions.

MHCLG Table 1009 breaks the total affordable completion data down, according to whether the provided dwellings were newly built or acquired, by sub-tenure.

MHCLG Tables 1011C and 1011S report from 1991-92 onwards, affordable total completions and starts (from 2015-16), according to type and source of funding (including nil grant S106).

A dropdown box at the top of these tables allows users to access data at region and LA level.

MHCLG Table 1012 reports affordable housing starts and completions, funded by Homes England, combined with data with the GLA from April 2012, both for starts and completions, between 2009-10 to 2023-24.

The latest Homes England  and GLA dedicated affordable supply data for 2023-24 can be accessed via the aforementioned links.

Homes England and GLA are focused on the delivery of dwellings subject to their programme funding support.

The MHCLG affordable housing series has a wider remit to provide a complete picture on affordable housing delivered, irrespective of funding mechanism or its source, using more disparate sources, most notably LA annual housing statistical (LAHS) returns.

LAs are asked to only record affordable housing that has not been reported by Homes England or the GLA.

This should predominately be affordable housing that did not receive grant funding or developer contributions under planning agreements.

However, Homes England has confirmed that some nil grant S106s are indeed included in its data returns, and it is possible that some LAs double count by including them also in their LAHS returns

As their 2023-24 start and completion data are published in the following June, rather than in December, as is the case with the MHCLG series, these  two Homes England and GLA are utilised in a summary table in the scan forwards sub-section that follows.

New MHCLG Table 1013 breaks down affordable provided completions, by type of provider, whether LA, or registered, or non-registered providers, or unknown.

It advised that RPs provided 49,844 of all the 63,605 affordable dwellings recorded for 2022-23, compared to LAs that provided 8,906, with non-registered providers accounting for 2,273. Another 2,582 dwellings were classified as of unknown sub-tenure.

Of the LA provided affordable dwellings, 60% were let at Social Rent or London Affordable Rent (LAR) levels (3,926 SR plus 1,419 LAR: 5,345 in total): the highest figure since the series started in 1991-92, but still only 8.4% of the total affordable supply provided in 2022-23.

Annex Table Four summarises affordable completion data across the entire 1991-92 to 2022-23 series period, taken from MHCLG Tables 1009 and 1011C, broken down to sub-tenure.

The 63,600 new affordable homes provided in England in 2022-23 is the highest reported since 2014-15 and a seven per cent increase on 2021-22.

Gross annual total or all affordable provision across the most recent April 2018-23 period averaged about 58,000 dwellings, representing the highest level recorded since April 2007-11.

It coincided with the end of the 2016-23 Affordable Homes Programme, as did the earlier 2014-25 uptick peak with the end of the 2011-15 Affordable Homes Programme: funding programme approval and delivery profiles result in years where starts and completions are bunched.

Although the latest peak was considerably above the April 1999-2003 low point average of 33,500, it still fell short of the 68,200 annual average dwellings provided during the April 1992-96 entire series peak point period.

Although Table Annex Four appears to report relatively stable total affordable provision totals on a decadal average basis, in practice they could fluctuate quite sharply within each decade in response to programme profile issues, to funding availability, and to wider economic conditions.

Total new build affordable completions increased progressively decade to decade in total and as a share of all affordable completions as acquisition and conversion provision decreased (subject to the compositional issues discussed below).

The table also reports that since 2001, annual affordable new supply has accounted for a stable close to 27% share of total net new housing supply as reported in MHCLG Table 120 (see Annex Table One).  

But as Annex Table Four also shows, that share increased sharply in the wake of economic downturns (when private speculative activity contracts).

This it did across the post-GFC 2010-13 period when it rose above 40%, as affordable dwellings funded by a relatively previous generous affordable programme settlement were completed during a period when private completions were at record low levels as a lagged impact of the GFC.

The share tends to decrease, albeit less sharply, during upswing periods marked by private sector recovery. This it did during 2002-06 and 2015-17 periods to a share of 24% or below.  

Taking account of the compositional mix

The sub tenure composition of provided affordable housing has changed markedly since the mid-nineties.

As Annex Table Four, summarised in Table 3, shows, the predominance of dwellings let at Social Rent (SR) levels started to decline from 1997-98 onwards.

56,900 Social Rent dwellings were provided in 1996-97 – greater than two and half times of the 21,700 SR completions reported in 2004-2005, and four times the 13,900 dwellings (including LAR) provided in 2022-23 – the most since 2012-13.

While the sub tenure still provided 82% of all affordable dwellings in 1999-2000, its share had declined to 57% by 2009-10.

This was  a combined product of falling SR volumes and the rising intermediate sub tenure completions that accounted for the remaining share of the programme, to about 42%.

The share taken by SR then collapsed to 14% in 2014-15, although most affordable dwellings were let at Social Rents until 2012-13.

This was the result of the introduction by the 2010-15 coalition government of the Affordable Rent (AF) sub tenure and the associated diversion of public grant funding in support of AR provision, which that year provided 62% of total affordable dwellings.

Intermediate tenures accounted for the remaining 24%. Their volume had decreased from 24,800 in 2009-10 to 15,800 in 2014-15 before dipping further to 9,300 in 2015-16.

Since 2014-15, shared ownership (part owned, part rented) homes have provided about a third of all affordable housing supply, becoming the predominant affordable home ownership sub-tenure.

Overall, all affordable home ownership sub tenure types since 2018-19 have accounted for the same 35% to 38% proportion of all affordable dwellings that it did twenty years ago.

During the latest 2018-23 period nearly three quarters (74%) of the average annual 36,100 combined social and affordable rent completions total were let at higher Affordable Rental levels, with SR providing an average 9,700 dwellings compared to 26,400 AR completions. Intermediate tenures provided an average 16,400 dwellings annually.

SR volume recently increased in 2022-23 to nearly 14,000 dwellings, enlarging its sub tenure share (including LAR) to 22%. By then AR’s share of affordable completions had fallen slowly but progressively to 38%, totalling 24,300 dwellings.

These compositional changes in the affordable housing programme concerning the volume and tenure share shift away from SR in favour of AF, as was identified above – as well as possibly other potential ones not reported or highlighted here, including changes in the bedroom composition of the provided dwellings and/or their location – provide a salutary example of the care needed to interpret time-series data on a consistent like-for-like basis.

Here, to take account of, and to statistically adjust for the shift away from SR provision towards government Affordable Rent (AR) housing provision, Table 3A  has applied the following weightings: Social Rent = 1; Government Affordable Rent = 0.625; Other Intermediate = 0.5.

When these are applied, the 2011-21 decadal average annual completion figure compared to that of previous 2001-11 period, total affordable completions transpose from around nine per cent higher to around nine per cent lower.

The most recent 2018-23 annual average affordable completion figure is also greatly reduced from about 27% higher than the 2001-11 average to about one per cent higher.  

Tweaks to the weightings applied would vary that outcome.

Table 3A also shows that, disregarding programme and other cyclical variations – and after adjusting for the compositional effects identified above – gross affordable supply when measured on a cross-decadal average basis has proved broadly stable in total volume terms.

Total affordable completions on an average annual decadal basis, weighted as above, reduced from 36,900 during 2001-11 to 33,700 during the following decade. The most recent 2018-23, half decadal average was slightly higher at 37,300.

Such apparent relative long-term stability of affordable housing supply, of course, is a different issue as to whether gross affordable supply in volume and compositional terms was – and is – sufficient and/or well-targeted relative to prevailing and changing socio-economic circumstances and needs.

These can include demographics, wider housing supply and its composition, and its affordability relative to individual household income and other circumstances rather than official definition.

And, as will be shown in the following Section Four, new gross affordable supply crucially also does not necessarily equate with new housing letting opportunities.

The paramountcy of S106 nil grant to new affordable supply

Annex Table Five uses MHCLG Table 1011C to estimate the number and proportion of all completed affordable dwellings using Section 106 (S106) affordable housing obligations to deliver affordable housing without the use of public grant both in total and by sub tenure.

Such affordable dwellings are generally secured through the planning system through developer cross subsidies realised from sales of dwellings sold at market values.

This table identifies a general trend since the nineties – save for some trend interruption in the wake of the Global Financial Crisis (GFC) – for the proportion of affordable housing across tenures provided through S106 to progressively increase

This is to a point where S106 nil grant has become the primary reported funding mechanism of affordable housing.

They exceeded 50% of total affordable completions in 2019-20, and 47% of them in the latest reported 2022-23 year.

The story of how S106 became the primary funding mechanism of affordable housing is recounted in Section 1 of  The new infrastructure levy: going-round the mulberry bush.

In terms of sub tenure composition, nil grant S106, in general, delivers a greater proportion of intermediate tenure properties – about 53% in 2022-23 – than Social Rent (SR), where it delivered about 38%.

As ever, averages can mask variation. In London, only four of the 1,567 dwellings provided through conventional Social Rent (excluding London Affordable Rent) was provided though nil grant S106, although S106 nil grant did account for 39% of the London Affordable Rent dwellings provided.

Scanning forwards

Affordable starts for the April 2018-23 period by sub-tenure (when known) reported in MHCLG Table 1011S, provide an indication of future short-term gross affordable completion levels.

About 71,800 affordable starts were recorded in 2022-23. Annual average starts recorded during the 2018-23 period was 61,000 dwellings.

Unfortunately, it is likely that this figure over the 2023-25 period will fall back to below 50,000 dwellings.

The most recent data on affordable starts and completed funded by Homes England and the GLA, summarised in Table 3B, shows that in total, starts fell to about 31,000  in 2023-24 from 55,000 dwellings in 2022-23. In London they plummeted even more dramatically by about 90% to about 2,300.

The precise reasons for this sudden and apparently calamitous drop are not totally clear or, at least, accepted by competing stakeholders, but programme profile and approval issues, market conditions and costs, and the impact of post Grenfell and other regulatory requirements all seem to have played a part.

Public funded start data reported as funded by Homes England and the GLA can be expected to fall short of what will be reported in the more comprehensive MHCLG Table 1011S in December, for reasons explained earlier.

The 55,100 affordable starts reported by Homes England and the GLA for 2022-23 accounted for about three quarters of the 71,800 total later reported in Table 1011S.

Conducting a rough rule of thumb exercise, replicating that relationship would suggest about 42,000 starts in 2023-24. The December reported figure could, of course, be lower or higher than that, but the omens overall are to the downside.

Such a level in practice would require affordable starts to increase to about 58,000 in 2024-25 to get to an 2023-25 annual average of 50,000 dwellings, and a similar completions level projected forward into 2026-28.

Summary and possible policy implications

This section has reported a feast of data on affordable housing produced by MHCLG. So much, in fact, that it is easy to be overwhelmed by detail, missing the wood for the trees.

It is therefore probably sensible to summarise the main points or contours of the story.

First, the series does not purport to report changes in annual net affordable supply: the net flow of stock gains (predominately now new build provision, but also acquisitions, conversions etc) minus losses mainly from RTB and other sales and to a lessening extent demolitions) across each affordable sub-tenure.

That net supply flow can be either positive or negative (see Annex Table Three).

Nor does it measure affordable housing availability, as indicated by new lets (see Section Four and its accompanying tables).

Second, broadly speaking, contrary to the political heat and noise and spin often put on comparisons between periods generally bookended by changes in government and/or cherry picked to outlier peak or trough years, over successive medium term 1991-21 decadal periods total average affordable housing completions remained relatively stable within a 46,000 and 52,000 range.

Shorter-term gyrations linked to affordable housing programme approval and funding profiles, as well as to wider public expenditure funding choices occurring over comprehensive spending review cycles (see Annex Table Four) also feature.   

Example of the former was 2015-16, and of the latter, the squeeze on the affordable housing programme during the early noughties as result of the decision of New Labour to stick to the previous government’s spending programmes and to prioritise other areas of social spending.

Third, there have been, however, significant compositional changes, most notably in the secular volume and share decline of Social Rent (SR) provision, within the programme.

Average annual SR provision fell progressively from about 41,000 dwellings in the 1991-2000 decadal period, to 27,700 the following decade, to under 12,000 in the 2011-21 period.

Until 2011 that was largely a combined product of declining grant funding support of affordable housing and a shift to intermediate tenures within the programme.

The decision by the 2010-15 Coalition government then to further reduce and shift government funding support to affordable rent (AR), let at closer to 80% rather than  the closer to 50% market rental levels that SR is let at, meant that by mid-decade the proportion of the programme taken by that new sub tenure began to exceed 50%, before starting to drop back from 2019-20 onwards towards 38% (see Table 3).

Most affordable dwellings provided before the mid noughties were let at Social Rents; during the latest 2018-23 period, nearly three quarters (74%) of the average annual 35,800 combined social and affordable rent completions total were let at higher AR levels.

Fourth, even when such compositional changes are taken account of and adjusted for, as this section did (recognising that results could change if different weightings were applied), affordable dwelling provision since 2001 appears stable on a cross decadal comparison basis (see Table 3A).

The shift to AR allowed more output, officially defined as affordable, to be squeezed from a given level of resources. This, however, was at the cost of higher rents, higher housing benefit costs, worse affordability at a household level, and of heightened risk of pushing more families into poverty after housing costs, even though the rationale lent to its introduction included that AF would improve such metrics if it allowed households to move out of temporary accommodation or the PRS.

Shifting back to SR, however, will involve higher levels of grant support, which given the new government’s fiscal stance, may not be forthcoming, in which case such a shift could involve SR taking a continuing rising proportion of a stable or even a reduced total affordable provision total, while most poor households remained in the PRS.

Efficiencies such as moving to longer-term funding settlements and the targeting of funding support to the areas most in need of affordable housing, such as London, could help to weaken but not lift such trade-offs over time.

Since 2014-15, shared ownership (part owned, part rented) homes have provided about a third of all affordable housing supply, becoming the predominant affordable home ownership sub-tenure.

Overall, all affordable home ownership sub tenure types since 2018-19 have accounted for the same 35% to 38% proportion of all affordable dwellings that it did twenty years ago.

Fifth, a general trend since the nineties – save for some trend interruption in the wake of the Global Financial Crisis (GFC) – is for the proportion of affordable housing across tenures provided through S106 affordable housing obligation process to progressively increase from negligible levels in the nineties and noughties to become the primary reported funding mechanism of affordable housing, accounting for 47% of affordable completions in the latest reported 2022-23 year.

This provision route, in a sense, represented a privatisation of public housing investment into affordable housing (as did the stock transfer in the late eighties and nineties) allowing this time a portion of increased land values to be captured for affordable housing purposes.

In the absence of substantial increases in direct public grant support, this now established provision mechanism will need to continue to do much of the heavy lifting to support affordable housing provision, even though recent market conditions and cost pressures could reduce the scope for such a cross-subsidy mechanism, in the short term, if developer expected profit margins are not to suffer.

Longer term, increased delivery through this route in the absence of wider strategic reform of a private speculative housing business model predicated on profit rather than output maximisation within a market with multiple failures, will rely on higher house prices with attendant affordability and access problems.  

Sixth, the overarching message is that since the nineties both Labour and Conservative governments have struggled to maintain affordable supply, especially of SR, due to increased fiscal pressures and a political unwillingness to prioritise housing relative to other spending programmes and/or tax cuts.

This is unlikely to change with the Starmer government. Although its fiscal rules will allow borrowing for investment, its commitment for public debt to reduce as a proportion of gdp (total economic output) by the end of the new parliament could cause problems and even prove self-defeating, given the potential capacity of increased affordable housing to contribute to growth generation.

Since 2001, annual affordable new supply has accounted for about 27% of total annual new net additions (supply) on a decadal average basis (see Annex Table Four).

For the new government’s commitment to deliver 1.5m new homes by 2029 to be achieved that share will need to increase substantially (see section five for a more detailed analysis).

There is simply little or no prospect of private speculative annual completions reaching the 200,000 to 250,000 dwelling level (250,000 + 50,000 affordable = 300,000; 200,000+100,000=300,000; the more realistic private speculative maximum of 180,000, would require an affordable gross provision annual level of 120,000 dwellings).

The view of this website is that such a step change requires a recasting of both public and delivery systems where the provision of a variegated range of affordable housing sub-tenures is mainstreamed within both, but that is another story.

4          Social Housing Lettings

Data and some commentary reported in this section is taken from the MHCLG January 2024 Social housing-lettings April-2022 to March-2023 (Tenancies) statistical release (January 2024 MHCLGsocial lettings release), unless otherwise stated.

Again, definitions can be confusing. The release describes ‘social rented’ housing as that let at sub-market rentals including Social Rent (SR), Affordable Rent (AR), and Intermediate rent (IR) sub-tenures (see definitions set out in Section 3).

The distinction between new lettings and new first lets to tenants not previously social tenants, should be understood.

New lettings are the combined total of first lets of newly built or acquired properties and reletsof existing properties.

13% of new lets in 2022/23 were in properties that were let for the first time as social housing. The majority of these were new builds (11.5%) with the remainder being made up of new leases (0.5%) and conversions, acquisitions and rehabilitations (0.8%).

87% of new lettings were relets of existing social housing (overwhelmingly LA+RP) stock.

Total social sector (LA+RP) new lettings represent new housing opportunities to both their existing tenants and to households offered and accepting a letting new to the sector, including those coming from temporary accommodation (TA) and/or statutorily homeless.

Around a third (32%) of households starting a new social tenancy in 2022-23 were existing social tenants renewing or transferring within the sector – the remaining 68% entered from outside the sector.

New first lets to tenants not previously social tenants, while they can be the first lettings of newly built or acquired properties or be a relet of an existing property, are those made to households not previously social tenants – whether they formerly resided in the PRS or in other tenures, shared with others, or were in temporary accommodation or otherwise homeless or otherwise were not existing social housing tenants.

51% of total new Affordable Rent lettings were first let in 2022-23, compared to 38% of new Intermediate Rent lets, whereas only five per cent of new Social Rent lets were first lets in contrast to being relet.

SR, however, has remained the primary sub-tenure of the existing social housing stock, explaining why, notwithstanding the secular trend shift towards Affordable Rent (AR) since 2011, 83% of total new social housing (SR+LR+IR) lettings (including relets), 209,190 dwellings, were let at Social Rent levels in 2022-23.

AR accounted for the remaining about 17% of the 2022-23 total new lettings total, compared to 13% in 2015-16. In 2012-13 soon after the sub tenure was introduced, it accounted for seven per cent of total new sub-market lettings.

Intermediate Rent (IR) accounted for a negligible one per cent of total 2022-23 lettings.

The 20 largest social housing providers (in terms of total new and relets) provided 27% of total lets. Of these 20, only one was a local authority (Leeds City Council).

The top three largest PRP providers were Riverside Housing Group, Anchor Hanover and Sanctuary Housing Association, providing in total 16,000 new lettings or 6% of all new lettings in 2022/23.

Since 2007/08 the share of total new lettings provided by local authorities has fallen from 40% to their current 29% share.

PRPs in 2022/23 provided 71% of total 2022-23 social housing (LA+RP) lettings; LAs the remaining 29%.

75% of total new lettings were for General Needs (GN) and 25% were Supported Housing (SH) lettings.

SH is housing provided with special design facilities or features targeted at a specific client group requiring support, for example housing designed for older people or those with disabilities.

38% of GN lettings in 2022/23 were one-bedroom properties or bedsits; 41% had two bedrooms, 19% had three bedrooms, and two per cent had four or more bedrooms.

New letting opportunities and churn rates

Total LA new lets including relets, averaged over 400,000 between 1981-2000,  according to MHCLG Live Table 602, sourced from Local Authority Housing Statistics (LAHS) data.

Their churn rate (percentage of properties let as proportion of stock) increased during the nineties to reach a record 12.3% in 1996-97. That year nearly 417,000 LA dwellings were let, higher than around the 379,000 that were let in 1989-90 and the 404,000 in 1981-82.

Social Rent LA lettings thus held up well during most of the last two decades of the twentieth century despite the massive net loss of stock from the RTB that marked that period.

But, as Table 4 (also derived from MHCLG live table 602) charts, total LA new lets had fallen to about 327,000 by 2000-01 and then continued to calamitously collapse to about 80,000 in 2021-22, before experiencing a small uptick to about 87,000 total lets (including mutual exchanges and short-term lets) in latest reported year 2022/23.

In parallel their churn rate also continuously reduced from 2000 onwards, save for flatlining between 2007 and 2014, halving from 11.5% in 2000-01 to 5.5% in 2022-23.

Instructively, Table 4 also records that LA new lettings to households not previously living in a social housing dwelling plummeted to about 55,000 by 2022-23: less than a quarter of their 2000-01 level.

As discussed later, a secular trend related to the recent ballooning numbers of households in local authority provided and largely funded temporary accommodation (TA).

Neither MHCLG Table 602 nor Table 4 report RP lettings, which are not are not tracked by a consistent long term national time series.

However, the Continuous REcording of Lettings in Social Housing in England (CORE) series does provide data, using a different collection methodology to the LAHS.

It is a ‘flow’ measure of all new social housing lettings recording data at case level (i.e. individual lettings), whereas data in LAHS is a ‘stock’ measure of all social housing stock in local authorities. 

CORE also excludes mutual exchange, short-term and some other lets. Other classificatory changes, in addition, mean that comparisons over time should be made with caution.

Although CORE is designed to be a complete census of new social housing lettings provided by local authorities and private registered providers that own social housing stock, the provision of local landlord information is voluntary. Some LAs do not respond, necessitating a weighted imputation process to be undertaken by CORE using LAHS data.

Further detail and explanation can be found in the MHCLG technical notes that accompany the latest 2022-3 social housing lettings statistical release.

These differences at least partly explain why the LA lettings figures and the relet (churn) rate that Table Four report are higher than the CORE levels reported in Tables 4A and 4B, derived from CORE April 2022-23 social housing lettings data (tenancies, summary table), which includes a compendium of data tables reporting a massive range of tenancy information, some of which is disaggregated to LA and RP landlord level.

Table 4A reports trends in the numbers or volume of all lettings by RPs and LAs (including general needs and supported housing let at SR and AR levels) during the 20011-23 period.

In short, total social sector lets fell from 394,500 in 2011-12 to 251,900 in 2022-23.

It also charts a secular trend reduction in the LA relet or churn rate, similar to what Table 4 reported for all LA lettings between 2011-12 and 2022-23 (7.5% falling to 4.6% compared to 8.3% falling to 5.5% in Table 4). RP lettings as proportion of RP stock also fell from 11.2% in 2011-12 to 6.8% in 2022-23.

Table 4B drills down on general needs tenancies, separating SR and AR lets across LA and RP sub tenures, confirming that their combined lets of SR and AR general needs tenancies dropped from 252,000 in 2007-08 to 182,900 in 2022-23 (the 2020-21 figure of 166,500 was likely a Covid-related outlier).

Total RP lettings including for both general and supported housing needs across all tenancy types fell from 267,200 in 2011/12 to 179,300 in 2022-23 across England.

As Figure 7 of the January 2024 MHCLG social lettings statistical release shows graphically, this was despite the RP stock increasing in net numbers whilst new LA lettings have fallen by more than LA stock did.

Reduced churn relet rates and the secular falling letting trend are a linked feature of both sub tenures.

Declining social housing churn or relet rates in isolation, or in combination, could be attributed to:

  • a widening affordability gap between social and market rents;
  • previous and continuing net stock losses (a RTB cannot be relet)
  • an intensifying inability or unwillingness of social tenants to exit the tenure due to their persistent and unchanging disadvantaged labour market and their other socio-economic characteristics;
  • changing tenancy age structure profiles;
  • longer void turnaround times;
  • allocation policies; or
  • other unidentified factors.

The MHCLG in its January 2024 social lettings statistical release, pointed out that generally a higher proportion of stock was relet (churned) in northern England than it did in the south: 7.1% of the combined social stock (LA + RP) in the North East region was relet during 2022/23, compared to 2.3% for London.

It went on to suggest a trend connection with regionally varying social rented (SR + AR) levels and local market affordability.

Figure 24 of the same release graphically represented median (mid-point) weekly rents (£) by rent type, between 2007/08 – 2022/23, across England, indicating a median market rental rent of about £200 in 2022/23 compared to about £180 for AR and about £130 for SR.

Such figures, however, will be influenced by the generally higher churn (relet rate) of social sector rental properties in northern and midland areas. Such properties are let at relatively low rents across those areas compared to high-cost areas, such as London that exbibit low churn. This is another example of a compositional effect.

Figure 26 of the same release plotted the average rent for new social lets (lets at sub-market rents, not just SRs) as a proportion of market rent by local authority area, for 2022/23. They ranged between 25% and 80% of market rentals at the extremes.

Although linking regional rental variances to churn rates accords with common sense observation, supported by any passing acquaintance with the London’s prevailing house prices and market rental levels (recognising their variation within the capital) –(see section six).

Yet the data and current evidence is insufficient to delineate and to definitively quantify separately all the contributory causes of both declining churn rates and letting volumes.

Statutory homeless acceptances

Definitions and interpretations of the homelessness legislation is largely taken from the government’s Homelessness Code of Guidance, unless other stated.

Homeless households found to be eligible for assistance, who are unintentionally homeless and fall within a priority need group (responsibility for dependent children, pregnant women, people over retirement age and others deemed vulnerable, as well as those facing an emergency, such as fire and flood) are owed a main statutory homelessness duty under Part Seven of the 1996 Housing Act by the local housing authority that they have a ‘local connection’ with.

The Homelessness Reduction Act (HRA 2017) further focused on preventing individual and family homelessness through the introduction of new prevention and relief duties. All applicants now are entitled to a minimum 56 days of assistance under the prevention and relief duties, prior to a main duty assessment and decision.

A prevention duty is now owed to applicants threatened with homelessness within 56 days, including when a Section 21 eviction notice (ending an assured shorthold tenancy) has been served which expires within that period, including the provision of advice and assistance.

It applies regardless of priority need status, intentionality or local connection, but generally will not cover applicants subject to immigration control (see chapter seven of the guidance for detail).

To discharge the duty, LAs are required to “take reasonable steps to help prevent any eligible person who is threatened with homelessness from becoming homeless… either (by) helping them to stay in their current accommodation or helping them to find a new place to live before they become actually homeless” (para 14).

The prevention duty continues for 56 days unless it is ended by an event, such as accommodation being secured for the person, or by their becoming homeless.

The relief duty applies where the applicant is or becomes or already is homeless, despite prevention stage intervention. It requires responsible LAs “to take reasonable steps” to relieve an applicant’s homelessness, focused on helping the applicant to secure accommodation available and suitable for their occupation, for a period of at least six months.

Where the housing authority has reason to believe a homeless applicant may be eligible for assistance and possesses a priority need, they must be provided with such interim accommodation (para 15).

The relief duty also lasts for 56 days, by which time the applicant should be provided with a decision as to whether they are owed a main homelessness duty or not, although if it is yet to decide on whether the applicant is in priority need and/or intentionally homeless and there is reason to believe that the applicant is in priority need, the interim accommodation duty owed under the relief duty continues until a decision is made on the main housing duty.

If no main home homelessness duty is owed the responsible LA possesses no further homelessness duties for the applicant.

During calendar year 2023, the relief duty ended for 63,650 households of which:

17,860 were secured accommodation in supported hostel or housing, 17,220 in the PRS, 11,860 in RP accommodation, 7,160 secured a council tenancy, while 3,710 stayed with friends and family (Table R2, homelessness statistics, see link below).

A responsible local authority owes an applicant, who is homeless, in priority need, and not intentionally homeless, a main homelessness duty under the 1996 Housing Act, as set out at the beginning of this sub-section.

That definition was not changed by the 2017 HRA. However, such applicants are now only owed a main duty if homelessness was not prevented during the preventative and relief duty stages and where they fall within the priority need categories (set out in more detail below) and are not intentionally homeless (paras 16 and 17).

Certain categories of household have priority need if homeless, such as pregnant women, families with children, and those who are homeless because of they are a victim of domestic abuse or due to an emergency such as a fire or flood.

Other groups may be assessed as having priority need because they are vulnerable because of old age, mental ill health, physical disability, or having been in prison or care or because of becoming homeless due to violence.

When determining whether an applicant in any of the categories set out above is vulnerable as defined under the homelessness legislation, the responsible LA should determine whether, if homeless, the applicant “would be significantly more vulnerable than an ordinary person would be if they became homeless”.

The main duty requires responsible LAs to provide temporary accommodation until the duty is discharged.

Usually this will be through the offer of a settled home (whether accepted or refused by the applicant), which could be suitable secure or introductory tenancy with a local authority, an offer of accommodation through a private registered provider (also known as a housing association) or a suitable tenancy for at least 12 months from a private landlord made by arrangement with the local authority.

The duty can also be discharged by the LA providing advice and assistance that is sufficient to secure an offer of such secure accommodation that is reasonable and suitable given the applicant’s circumstances. 

It will also end for the responsible authority where the applicant turns down a suitable offer of temporary accommodation, abandons or loses it, or otherwise ceases to be eligible.

Alternatively, it may be possible for the applicant to be ‘homeless at home’, where, for example, an unsustainable family or sharing arrangement is extended on the basis that alternative secure and suitable accommodation will be made available in the future.

During calendar year 2023, the main duty was ended for 43,020 households. Three quarters – 31, 530 – accepted a social tenancy (Part Six 1996 Housing Act social housing offer). 2,860 accepted an offer of PRS accommodation (Table MD2, homelessness statistics).

The MHCLG homelessness statistics collection includes a range of data tables on reasons why applicants became homeless, their circumstances, and actions taken under each of the homelessness duties.

Information at a local LA level can also be obtained from MHCLG detailed local authority tables at a quarterly level and for financial year 2022-23, as well as from its data dashboards on homelessness  and rough sleeping, although this website found them tricky to navigate.

Table 4C reports statutory main duty homelessness acceptances from 1998-99 onwards, at an England level, using the MHCLG source collection.

Until 2004-2005, such acceptances (as then defined) exceeded 100,000 but then fell sharply to about 40,000 in 2009-10.

Subsequently acceptances then rose steadily to about 59,000 in 2016-17, before nearly halving to about 31,000 in 2018-19.

That year represents a discontinuity in the data as it marked the introduction of statutory prevention and relief duties enacted by the 2017 HRA.

Table 4C records that main duty acceptances have since returned to around the 60,000 level for 2023 calendar year (which is also the expected estimated figure for 2023-24).

Recourse to temporary accommodation

Annex Table Six records the numbers placed in temporary in accommodation (TA), by LAs further to their homelessness duties under the 1996 Housing Act and the 2017 HRA defined above.

By 1 January 2024, a record 112,600 households were in such accommodation: more than double than the close to 50,000 households placed during calendar years 2010 and 2011.

Indeed, after falling from 101,000 in 2004 (all dates refer to TA position at 31st December of the year cited) to 48,000 in 2009, numbers in TA have steadily since increased to their current level.

A July 2024 Audit Commission tackling homelessness report (NAO 2024 homelessness report) advised that the DLUHC (now MHCLG) had concluded that the government achieved the reduction between 2004 and 2010 “through a public commitment to halve the number of households, coupled with significant investment and proportionately higher Housing Benefit” (para. 1.23).

The current near 113,000 total encompasses:

  • 29,400 nightly paid self-contained private accommodation placements, including self-contained annexes to hotels with very basic cooking and washing facilities (compared to less than 6,000 between 2002 and 2014);
  • 26,700 in dwellings leased by the accepting LA and/or a RP (compared with more than 40,000 between 2004 and 2007);
  • 33,400 put in temporary accommodation outside their home LA area – more than three times the levels that was recorded between 2003 and 2012;
  • 16,000 were in hotel bed and breakfast accommodation, even though in 2003 such accommodation was prohibited for households responsible for dependent children except in an emergency, and then for no longer than six weeks.

Recourse to TA is uneven, and is concentrated, as one would expect, across high housing need/stress areas, most especially Greater London and Greater Manchester within the North West.

A 2022 Smith Institute study reported a worsening situation in the majority of London boroughs and in the City of Manchester, where the number of households per thousand households was found three times the England average (in volume more than the whole of Yorkshire & Humber) during 2021-22.

The problem was most acute it found in some London boroughs: in Newham it was 12 times more; Southwark, Redbridge six times; in Wandsworth and Westminster five times.

More up-to-date information is provided in Figure 7 of the NAO 2024 homelessness report, which whilst confirming that use of temporary accommodation is particularly concentrated in London and parts of the South East and North West, especially City of Manchester, shows that its use is also scattered across the country and is not confined to those areas.

That said, in last quarter 2023, according to the latest available official data, 63,240 of the total 112,600 households placed in temporary accommodation were in London: 56% of the England total.

Such outcomes can also be linked to declining LA and RP letting availability. Directly provided CORE data reports sharp falls in new lettings to households new to the social sector, falling from 240,700 in 2007-08 across England to 147,000 in 2022-23.

Table 4D documents an even more calamitous long-term fall across London. LA first lets to new social tenants (including those accepted as statutorily homeless) in London fell from 40,500 in 1996-97 to 13,700 in 2011-12, before falling a further 33% to a reported 8,500 by 2021-22.

According to that same GLA Housing in London 2023 source, RP lettings to new social housing tenants fell even more sharply (45%) across the 1996-2022 period from 9,300 to 5,000, even though – unlike the LA sector – the RP sector grew in net stock size during that period.

In total social sector (LA+RP) lets to households new to social housing in London fell from 49,800 in 1996-97 to 13,600 in 2021-22.

CORE data also advises that total social sector lettings in the capital to tenants new to the sector halved from 28,800 in 2012-13 to 14,400 in 2022-23.

Also, according to CORE information that Tables 4E and 4F reproduce, 7,500 combined lettings were made by LAs and RPs in London to households coming from TA or who were statutorily homeless in latest reported year 2022-23 (compared to about 73,000 nationally).

That flow of new lettings to households previously in TA or who were statutorily homeless undershot the 12,040 main duty homelessness acceptances recorded by London responsible authorities during 2022-23 (Table MD3, MHCLG homelessness statistics, detailed local authority statistics, 2022-23).

A gap that seems to provide the main reason why the use of TA is so concentrated in the capital.

International comparisons

A recent article by the authoritative Financial Times (FT) data analyst,  John Burn-Murdoch, noted that homelessness among OECD countries was worst in the UK, when measured by the total numbers, who in 2023 or later, were placed in temporary accommodation.

The UK exhibited a staggering rate of 50 per 10,000 households in temporary compared to about 30 in France, 25 in Germany, 20 in the United States (US), and six in Denmark.

It, however, exhibited a rate of less than one for rough sleeping (varies between the UK’s constituent countries and cities) in contrast to nearly five in Germany and eight in the US.

On the face of it, such statistics suggest relative UK institutional effectiveness relative to its international peers in responding to rough sleeping that obvious and stark manifestation of homelessness, amid the patent ineffectiveness of its overall housing system(s) in meeting general housing need.

It should be borne in mind, however, that the metrics involved will vary in definition, in interpretation, and in measurement methodology between countries, as will the social context in which rough sleeping, especially, takes place. 

The MHLCG Ending Rough Sleeping Data Framework, provides quarterly management information on five core indicators underpinning the four aims of the vision for ending rough sleeping: that it is prevented wherever possible, and where it does occur, it is rare, brief, and non-recurring.

In that light, 3,898 people sleeping rough were recorded on a single Autumn 2023 snapshot night, higher for the second year in a row, but lower than the peak of 4,751 previously recorded in 2017 (Para 2.11 of the NAO homelessness report).

Table 4.4 of Housing in London 2023 report advised that outreach teams recorded 1,614 people sleeping rough in London for the first time, in the second quarter of 2023, representing an increase of seven per cent on pre-lockdown figures.

Most new rough sleepers spent one night only sleeping rough, including during the height of lockdown, when emergency rough sleeper accommodation programmes run by the GLA and London boroughs helped to reduce the numbers of rough sleepers, particularly in early and mid-2020.

Summary and policy implications

Resource to temporary accommodation is not only disruptive and unsuitable for settled family life and for future social-economic advancement but is also costly in short term current public expenditure terms.

Figure 5 of the of the 2024 NAO homelessness report showed that in 2022-23 spending by English LAs on the use of temporary accommodation exceeded £1.6bn: more than double in real (inflation-adjusted) terms than it was in 2010-11.

Local authorities pay for temporary accommodation and reclaim the costs as a subsidy from Department of Works and Pensions (DWP). The Temporary Accommodation Subsidy that they then receive is based on Housing Benefit rules and the Local Allowance Rate (LHA) rate, not updated for long periods from January 2011.

As that central subsidy source has been in effect capped on welfare expenditure control grounds, it has not kept up with rising costs at the local TA coalface. The resulting deficits that LAs incur on TA accommodation have consequently swelled, piling on their financial pressures.

These, according to the same NAO report, given the share of their net budgets taken by TA costs, could soon drive some LAs into bankruptcy.  TA now costs London LAs £1bn per year with £332m of that falling on their own budgets.

The NAO report also pointed out that a significant portion of the centrally financed Homelessness Prevention Grant has been diverted to fund the provision of temporary accommodation, particularly in areas of poor affordability, rather than being spent on prevention work.

This is a classic case of Peter robbing Paul resulting from immediate pressures trumping longer term best value and delivery outcomes – a tendency that has become increasingly prevalent across welfare state provision.  

Such are the facts on the ground that the new chancellor, Rachel Reeves, when deciding public housing investment allocations in accord with set fiscal rules (in Labour’s case, borrowing for investment is allowed but its volume must be consistent with a reduced public debt/gdp ratio by 2029), will need to grapple with in her first 30 October 2024 budget and the subsequent 2025 Comprehensive Spending Review (CSR) process.

Targeting and increasing housing investment funds to the LAs with the highest TA bills, mainly in London, presents a strong investing now to save later case, a baton  picked up in a densely researched and argued New Economics Foundation (NEF) March 2024 Buying Back Better report.

After reviewing the GLA Right to Buy-back (RTBB) 2021-23 scheme, which saw around 1,300 homes bought by councils quicker and often more in accord with client requirements than they would have been if built or obtained through protracted developer affordable housing obligations, the report highlighted that its successor scheme, the Council Homes Acquisition Programme (CHAP) – contingent on sufficient central funding support and tweaks to Approved Development Programme (ADP) rules – could allow London councils to acquire 10,000 homes over the next ten years, or 1,000 annually.  

Such an outcome, the report estimates, would over the next two decades reduce their TA costs by £1.5bn, trim central government housing benefit subsidies by £340m, and generate additional indirect savings of £440m, including projected £39m short term HB savings. Prioritising TA acquisitions within such a programme would save £26m; prioritising general needs acquisitions £49m.

Annual government-wide savings from CHAP would, the report projected, outweigh annual costs including loan repayments after 16 years, when annual savings would begin to accumulate, further noting that if the housing benefit subsidy cap is uprated, greater savings to LAs would result (although central government HB expenditure would increase, all other things being equal).   

A 2022 Audit Commission Review of the AHP since 2015 had earlier revealed, using government research, that in London, future housing benefit savings over 30 years would cover the cost of 69 per cent of the grant cost of providing new homes for social rent, and that this would go up to 110 per cent over a 60 year period, leaving aside savings in temporary accommodation and social care costs.

One step back. Grant rates under CHAP are higher than were under the RTBB scheme, providing grants for up to £200,000 for each social rented home; and for £85,000 for each TA home acquired.

This spend now to save later approach is a microcosm of the wider argument that transferring PRS households receiving housing benefit (HB) to the social sector would accumulate savings in central revenue expenditure over time.

Lower SR rents would require less HB support, underpinning arguments for a SR programme approaching 100,000 new homes annually, as, to take one example, is argued here.

Expanding such funding would therefore be a call on constrained public investment resources with the financial return extended into the long term beyond the lifetime of two parliaments.

While the increased availability of local authority-owned accommodation let at SR rents could produce significant long-term savings for taxpayers via reduced housing support costs (whether centrally or locally funded), that is a hope rather than a certainty.

Future HB costs will depend on a range of future unknown as well as expected factors.

Political focus, on the other hand, is geared to the short to medium term, as are Labour’s fiscal rules: not 15 or 25 years, let along 30 or 60 years, unfortunately.

In truth, the prospect of an annual new SR centrally funded programme being scaled up to approach 100,000 dwellings by 2029 (five years ahead), even when supported by a more certain and robust developer contribution policy regime and helped by a reformed Compulsory Purchase Order (CPO) process effective in reducing land acquisition costs closer to existing use value, seems uncertain at best, and unlikely, probably.

This is, even though, as the next section will demonstrate, Labour’s flagship commitment to deliver 1.5m additional homes in this parliament will depend on – amongst other outcomes, such as expeditious and effective delivery of its New Town, urban extensions, and devolution ambitions – an expanded affordable homes programme rising to a sustainable 100,000-150,000 annual level, sooner rather than later.

As the 2022 Audit Commission report cited above highlighted, the existing regional distribution of AHP grant fails to reflect either the variations in need for investment in different parts of the country or the benefits that would flow from altering it.

The data reported in this section has also demonstrated the linkage between declining social sector lettings and rising recourse to TA, concentrated in London and other high need hotspots.

The case for adjusting the AHP as part of the 2025 CSR in favour of London and tilting it towards supporting additional social housing provision across such areas appears overwhelming on both housing need and expenditure efficiency grounds.

Likewise moving to a ten-year rather than a five-year AHP, as proposed in the 2020 Double or Quits  University College of London (UCL)  Bartlett School of Construction and Project Management  report, and subsequently by many  stakeholders, accompanied by other efficiency enhancing programme rule flexibilities, should allow potential supply volumes and efficiency to be increased, as well as help to smooth delivery over the duration of the programme, avoiding programme-end peaks.  

More broadly, greater attention on the lettings data reported and their implications seems justified and necessary. At the end of the day, it is the letting capacity and the flow of annual new lettings of social landlords that determines new housing opportunities for households in housing need.

Given the low churn rate in high cost and high need areas, especially London, the systematic routemap to maximise LA letting capacity through the development of letting chains that a former Southwark Council cabinet lead for housing, set out in another 2022 Smith Institute publication, appears pertinent.

Given RPs dominant sub-tenure and repository of public investment status and position, more transparent and topical information on the volume trend of LA nominations to RPs could also be helpful.  

5        New housebuilding, indicators of new supply, and final tenure estimates

The MHCLG in September 2020 changed the title of its “House building: new build dwellings’ statistical release to “Housing Supply: indicators of new supply”.

As the series live tables were predominately concerned with new build, this was a confusing change, in the view of this website, risking conflation with the “Housing supply: net additional dwellings” series covered in section one.

A recent quarterly published statistical release stated the purpose of the series is: “to provide an indication of the levels of and trends in new housing supply in England” advising that it should “be regarded as a leading indicator of overall housing supply”.

Section Four of the release continues to highlight the building control reported new build starts and completions data (termed in this post, the new housebuilding series), even though, as explained and demonstrated below, it covers 80% or less of house building activity in England and systematically undercounts new build activity.

Section Five of the release does, however, cover other indicators of housing supply, advising that along with the above they are intended (in totality) to “provide a suite of information which give a rounded estimate of the current trends in housing supply and an indication of what the more complete estimate of housing supply, net additional dwellings, will show when it becomes available in November 2024”.

New housebuilding series (MHCLG ‘new build dwelling’ figures based on building control inspection data): the live tables

MHCLG Table 213 covers both new build starts and completions, by tenure of the provider, both on an annual financial year (from 1969-70) and on a quarterly non-seasonally adjusted basis, (from quarter, Q1, 1978 to Q2 2023 at the time of writing, then updated by the quarterly reporting cycle).

It starkly reports that during 2023-24 only 134,780 new build dwellings were started (the lowest since 2013-14), 104,310 of which were reported as built by private enterprise (the lowest since 2012-13).

During the same period, 153,800 dwellings were completed, 115,780 of which were reported as built by private enterprise (both figures the lowest reported since 2015-16).  

MHCLG Table 222 provides similar but quarterly seasonally adjusted figures.

MHCLG Table 244 catalogues the longer-term new housebuilding record, broken down by tenure, on a calendar year basis, from 1946 onwards.

MHCLG Tables 217, 253 and 253a report dwellings completed and started by tenure, broken down to region (quarterly) since 1990-91 (217), LA district (253, by financial year, 252a, quarterly since 1980-81).

MHCLG Table 254 reports completions and starts, by house or flat type, by bedroom size, and by tenure. 

The Office of National Statistics (ONS) in its House building, UK: permanent dwellings started and completed by country statistical series also continues to publish new housebuilding data according to country, as well as at a pan Great Britain and UK levels. 

ONS tables relating to England replicate the live tables published by the MHCLG and are updated to incorporate revisions, unlike the annual statistical release commentaries.

New housebuilding series (MHCLG ‘new build dwelling’ figures based on building control inspection data): development, methodology and undercounting

The new housebuilding series began in 1946, sourced solely from LA building control information, considered the best source to identify when new build dwellings are started (specifically the commencement of construction in laying of foundations) and the timeliest measure of new build completions (as measured by the completion certificate).

However, such sources became increasingly fragmented. National House Building Council (NHBC) data was added from 1985 and then in 2007 independent approved inspectors also became a statutory source of data.

The MHCLG estimates that the building control sourced data source currently provides information on about 80% of house building in England.

In computing the series, MHCLG statisticians make allowances for non-response (reported as high as 78% for independent approved inspectors in Q1 2023). This done through a process of imputation from past returns to take account of late submissions.

The technical notes accompanying the series recognises, however, that late and non-reporting continues to prove a problem.

Indeed, both the MHCLG and ONS live tables under-enumerate recent new build completions, often by a large magnitude.

Annex Table Seven reports that the annual discrepancy (undercount) between the new completion totals reported in Table 213 of this series and the more accurate net supply Table 120 reached an annual average of about 24% across the most recent 2018-23, period, compared to an average of about 17% across the entire 2006-2023 period covered by Table 120.

This ONS new housebuilding series similarly consistently undercounts recent new build activity.

Reporting new housebuilding by tenure more accurately

The MHCLG interactive dashboard published with this series provides important new data on new build completions by final tenure, when occupied.

This is the final tenure usage of the new dwelling, whether for future private ownership, for housing association or for local authority housing use.

The final tenure use of a completed dwelling is not necessarily the same as the tenure of the developer that built it because private developers also build dwellings for housing associations and local authorities, as well as predominately for onward private sale.

Indeed, as was discussed in Section Three and documented in Annex Table Five, a progressively larger proportion of affordable dwellings since the early 1990 have been built by private developers in accordance with S106 planning agreements concerning affordable housing obligations.

Some, perhaps most, of these dwellings are reported and recorded as private enterprise completions within the new housebuilding series tables, even though they are later transferred or sold to RPs for future use within their stock.

Annex Table Eight reproduces tabulated information that can be accessed from the series dashboard’s final tenure estimates tab (see previous link), cataloguing new build completions from 2006, by final tenure.

It utilises the more accurate net supply (total new build completions) and the affordable housing series (LA and RP new build completions) from 2006 onwards – when the new build component in the net additional dwellings estimates was first published – to model and estimate more accurately private enterprise final tenure figures (Section 7of the statistical release describes in more detail).

Prior to 2006, the tenure of dwellings, by provider, is derived from building control sources, meaning that the table reproduces new housebuilding series data.

The table also conveys the cyclical sensitivity of private speculative new build activity to the wider economic environment.

Annual private enterprise completions more than halved from about 164,000 between 2006-8, the high-water mark of an era of low inflation, interest rates, and steady economic and household income growth, to less than 70,000 between 2009-12, as the lagged impact of the GFC played out.

During the 2006-23 period, LAs and RPs accounted for – on an average annual basis – about 26% of all new build completions, by final tenure.

That proportion varied, however, not only with the annual trend of new build affordable completions but also with that of private sector completions: their collapse in 2010-11 largely explains why the social sector share of all new completions rose to about 42%, by final tenure that year, as it took a growing share of a dwindling total (the denominator fell proportionately more than the increase in the numerator).

As way of contrast, social sector (LA+RP) annual new build completions fell to historic lows of between 13,000 to 14,500 dwellings – less than 10% of total new build completions during the 2000-2003 period: a result that reflected the lagged impact of early New Labour housing investment levels having been crimped by its self-imposed commitment to keep to the previous John Major government’s spending requirements, as well to the higher priority that New Labour accorded to other social programmes.

It was only towards the end of its period in office, when, in response to the 2004 Barker Report, social housing investment allocations were quite substantially increased, enabling some recovery in social housing new building activity, which subsequently partially blunted the impact of the GFC on total completions. 

Projecting 2023-24 new building completions and housing new supply

Both the Conservative and Labour parties during the 2024 general election committed to deliver at least 1.5 million new homes during the lifetime of the next parliament – equivalent to 300,000 new homes each calendar year, 2025-29 inclusive.

Putting that vaunted ambition into perspective, about 212,000 new builds were completed each year from April 2021 to March 2023, according to the most accurate MHCLG new additions (supply) series, while net new supply (including gains from net conversions, change of use, less demolitions, additional to the 212,000 new builds) hovered around 234,000 dwellings (see Annex Table One).

Concerning the expected 2023-24 outturn, Section Five of the MHCLG’s latest new indicators of housing supply release as discussed above, provided analysis of indicators other than building control new build data, including Energy Performance Certificates (EPS) lodged for new dwellings, building and council tax data.

Instructively, the release went on to advise that the EPC statistics provide a very close estimate or proxy to net additions, almost to the point of giving an official steer that are the most reliable indicator of future new supply.

At time of writing, however, such EPC data is relevant to the immediate past 2023-24 financial year to be reported in November 2024 – at least until sufficient 2024-25 EPC data is reported.

In that light, Table 5 compares the number of EPC of certificates lodged for new domestic properties (new build, conversions and change of use to domestic) with MHCLG Table 120 net new additions (new supply) across 2018-23 actual net new supply outturns.

It indicates that net supply on an annual average basis was 0.98 below the reported number of EPCs granted across that period (although, this was after a retrospective census adjustment was made for the 2018-21 new supply figures).

Applying that 0.98 coefficient to the reported 232,473 new dwelling EPCs reported lodged during 2023-24, suggestsa 2023-24 new net supply figure of about 227,000 dwellings, continuing its recent downward trend. 

Projecting future 2024-27 new build activity and new supply: implications for Labour’s 1.5m delivery target

MHCLG new housebuilding and other indicator of new supply series data, as customised in Tables 5A and 5B, strongly suggests that the recent downward new supply trend will not be reversed during the early 2024-26 period of the Starmer government.

MHCLG Table 213 data reproduced in Table 5A reports that 481,240 new build dwellings were started between 2021-24, an annual average of 160,400.

To compensate for the systemic tendency for new housebuilding series to undercount, as was laid out above, an adjustment multiplier of 1.24 was applied to the to the Table 213 starts and completion data reported in Tables 5A and 5B to produce adjusted figures.

That adjustment made was consistent with 2018-23 under-enumeration of Table 213 MHCLG Table 120 new build completions of about 24% that Annex Table Seven demonstrated for the 2018-23 period.

The average difference between Table 213 reported completion totals across 2018-23 and the later net new supply annual reported totals reported for that period was 41.5% and an adjustment coefficient of 1.415 was applied on Table 213 start and completion data to produce projected future new net supply figures

On that basis, Table 5B projects a 2024-25 and 2025-26 net new supply outturn (assuming a two year start to completion gestation) of about 244,000 and 191,000 dwellings, respectively (the reported adjusted new build 2022-24 start totals rolled forward two years as completions), suggesting a 2024-26 financial year net new supply total of about 435,000 dwellings; or an annual average of about 220,000 across those two years.

Such a level would generate a cumulative delivery shortfall of about 160,000 dwellings relative to the 300,000 annual target by April 2026.

Such rule of thumb projections are inherently tentative and indicative. Although yesterday starts are tomorrow’s completions, starts data provide a forward but imperfect indicator of future completions: they are subject to cyclical fluctuation related to the external economic and market environment and to funding programme profiles and associated delays.

New build completions, in practice, can also lag for longer than might be expected if a one-to-three-year construction period is assumed. Large scale regeneration projects involving multi-phases invariably straddle many years.

Lags could also possibly relate to incentives to record starts for programme monitoring purposes or result from other unquantified reasons.

In short, there is no way of knowing precisely when reported starts will be converted into a conversion.

Given the subdued nature of the private housing market in 2024 and the expected continuing impact of high (albeit hopefully further softening in line with the July 2024 0.25% base rate cut) interest rates, little reason currently exists that 2024-2026 completion totals will prove much different to the expected and projected weak 2023-24 outturn.

Indeed, as Section Three projected, a downtick in new affordable supply annual starts over the 2023-25 financial year period to an average 50,000 dwellings or less can be expected, suggesting a similar level of affordable completions during 2025-27.

Future affordable supply prospects beyond that are uncertain given its dependence on private cross-subsidy (less is available in a weak private market), the future impact direction of building and labour costs, and RP ability to use reserves to finance new building considering post-Grenfell and environmental regulatory requirements that require increased investments in existing properties.

In such an environment, increased grant funding needs to be made available to secure a future step change in affordable supply. Angela’s Rayner’s 30th July statement to parliament on that score was vague in terms of whether the forthcoming CSR housing settlement would involve substantial additional resources rather than a refocus of resources towards Social Rent (SR) provision.

Increased ADP resourcing would involve a time lag of least two years before it translated into new build completions, although acquisitions involving programmes such as CHAP (discussed in section four) could be quicker.  

The new Labour government also intends to introduce a revamped mortgage guarantee schemes for first time buyers in place of the retired Help-to-Buy (HtB) and to prioritise implementation of its pledge to ‘build rather than block’ planning reforms and compulsory purchase order (CPO) process reforms.

But planning reform by itself, while necessary, will not result in the current speculative private market-led system delivering future housing volumes on the scale required.

The outlook for completion outturns going into 2027 is not much brighter, therefore, on any realistic reckoning.

 Barratt, example, in July 2024 announced a seven per cut in planned starts for the coming year into 2025 that will then inevitably translate into future 2026 and 2027 completions.  

Research conducted earlier in the year by Savills included a chart that indicated – assuming no increase in government housing support – annual new build completions not breaking through 160,000 throughout the remainder of this decade, meaning that annual net new supply would undershoot 200,000 let alone reach 300,000 (less than 1m rather than 1.5m).

That doomsday scenario is unlikely to come to pass given Labour’s linkage of planning reform to its growth agenda, New Towns programme, and commitment to boost affordable housing supply, but the undoubted delivery shortfall projected above by 2026-27, supported by the work of other commentators, means that for the 1.5m  target to be achieved, supply would need to reach well beyond 300,000 during the 2027-30 period.

Even a 2024-27 (financial year as measured by MHCLG Table 120) cumulative new supply total of 750,000 or 250,000 annual average new supply across that period (on the current evidence, unlikely, as presented above, with undershooting much more likely), would require annual new supply delivery (let alone new builds) across the 2027-29 financial years to exceed 320,000 dwellings annually to achieve the 1.5m homes target (1.5m minus 750,000 = 750,000, which divided by two = 325,000).

This was something achieved last during the 1964-70 Wilson governments, and then not really, as it straddled a period when net supply was lower rather than higher than new build totals because of accompanying slum clearance demolition and redevelopment activity.

Starmer and Labour’s target presupposes that several New Towns and urban extensions, at least in substantial part, are planned, land acquired, prepared, approved, funded and completed by the end of 2029, amid a wider step increase in both private and public activity, measured by completions.

Angeal Rayner, herself, no doubt fortified by internal MHCLG briefings, intimated in her July parliamentary statement that supply would need to rise to 375,000 annually to compensate for early under-delivery.

Such outcomes, on the face of it, seems unrealistic, pure and simple.

Perhaps, a more realistic but still stretching target, requiring early concrete and effective policy action and reform, would have been to achieve 300,000 starts by 2026 calendar year on a future sustained basis.

Even that target would be tricky to measure, given the new housebuilding series (which measures quarterly without much time lag) related tendency to under count.

Indeed, the measurement problem where MHCLG table 213 new build starts and completions can be counted on a quarterly and annual basis but involve systemic undercounting, while the more accurate MHCLG table 120 new supply (net additions) table reports for financial years 18 months will, in any case, make the measurement of Labour’s flagship target, if not a fool’s errand, problematic, heavily exposed to political spin.  

Besides, because of construction lags and the overlapping impact of previous policies and conditions, a total production or supply target based on completions over the lifetime of a parliament didn’t and doesn’t make much sense, other than as a statement of political intent (hopefully) or spun aspiration (more usually).

Summary and policy implications

At a statistical reporting level, this website has previously recommended that MHCLG should advise users that the new housebuilding series should only really be used for two main reasons.

First, to consider longer-term trends related to the tenure breakdown of housing starts and completions, especially prior to April 2006.

Second, although the Housing supply: net additional dwellings series provides the best measure of new net supply and new housebuilding completions, it remains a lagged backward-looking metric that does not cover starts, requiring that recourse to the new housebuilding series as a leading but imperfect indicator of future near-term new build activity is necessary, complemented by other sources of evidence, where available and appropriate.

The new housebuilding series demonstrated tendency to undercount that, however, can be compensated for, as was done in this section, albeit on an imperfect rule of thumb basis, subject to phasing and contingent factors and uncertainties.  

The placing and enforcement by the MHCLG of more effective statistical collection and reporting requirements relating to housing starts and completions, although administratively challenging, would relieve the problem at source.

More importantly, scenarios based on the evidence currently available and considered in this section, point to a conclusion that the new government could possibly struggle to deliver over one million, let alone one and a half million, additional homes during the next 2024-29 parliament.

Even approaching Labour’s lifetime parliament target of 1.5m homes will require many New Towns and/or urban extensions to be identified, planned, authorised, funded, and at least partially completed within five years (something that would not necessarily show up in official statistics at the earliest in November 2030, probably more than a year after the next election).

Such a feat would require sustained political overarching focus and institutional coordination and drive of a nature unprecedented and unexperienced for decades.

It would also require public pump-priming infrastructure investment mid-decade rather than end-decade, enabled by a firm but flexible, rather than ironclad, interpretation of fiscal rules, focused on sustainable growth and best use of public resources over the medium term rather than mechanical and rigid calculations of future debt levels.

A focused, co-ordinated, streamlined and effective public-private partnership approach to housing delivery on lines suggested by the 2017 Letwin report, yet going further, in line with an overarching and primary political commitment to achieve a step change in housing, especially affordable, delivery accounting for a much larger than the current 27% share of total delivery.

These are preconditions but are not guarantors of the achievement or near achievement off the 1.5m target in practice rather than rhetoric.

The Starmer government in its July 2024 proposed planning reforms demonstrated its intent to remove blockages connected to local Nimbyism and other planning-related obstacles.

However, setting local delivery targets consistent with an annual supply level of 375,000 is not the same as securing their actual delivery on the ground. Councils do not currently build dwellings at scale (other than a few homes built for rent within the Housing Revenue Account (HRA)): developers do.  

Achieving such an elevated target, requires not only sufficient planning permissions but their implementation by profit-maximising private developers, whose current business model requires them to rather build and release dwellings for sale in step with that imperative, not government targets.

6          House Prices, Rents, Affordability and Access

This final section examines house price, rental, and affordability data, explaining their differences between the different sources available and their related uncertainties, complexities and limitations.

2022-23 English Household Survey (EHS) data is also utilised and reported to provide relevant information on household tenure and housing affordability circumstances

House prices: the different indices

Getting a handle on house price outcomes and trends is tricky. Several different sources often reported in the media use different data and methodologies covering different points in the home purchasing process, which vary in coverage.

For example, Rightmove use asking prices. Lender sources, such as Nationwide and Halifax, use their own mortgage approvals data. The UK House Price Index (UK HPI) published by the ONS uses mainly Land Registry data produced at the end of the conveyancing process and reports transacted prices.

The ONS explains the various house price index measures and their strengths and limitations in their publication Comparing house price indices in the UK.

This points out that although Rightmove’s index, which is based on advertised asking prices is the timeliest offering a leading indicator of future sale prices, properties may not ultimately sell and complete at their advertised prices, resulting in consequent inaccuracy.

Nationwide and Halifax indices are based on their own mortgage approvals, which means that they also can publish quickly. However not all approvals lead to a transaction; moreover, individual lender approvals are not necessarily representative of all approvals; even more seriously, these indices do not include the 30% to 40% of transactions that are cash purchases. These indices, therefore, may provide a biased estimate of actual sale prices.

The ONS series and the LSL Acadata series are the least timely as they use transaction (registration of the sale in the Land Registry) data at the end of the conveyance process, published usually around two months after the latest period reported.

These series are not, therefore, forward-looking and tend to be of less interest to the media when hungry for a timely and catching headline and for forecasters wishing to project or predict future trends; they are, however,more complete in ultimately capturing the set of actual transacted properties during the period that they report.

The average prices that UK HPI reports are a (weighted) geometric mean and by excluding the inflating impact of a few highly priced properties the UK HPI measure aligns reported mean (average) prices closer to median (midpoint values)

This in contrast to the simple average that the ONS quarterly house price tables, based on a on a sub-sample of the Regulated Mortgage Survey, report.

Figure 2 of the ONS guide cited above, which compared the average price time series for the various indexes, indicates that the UK HPI reported values, are as much as 25% lower than those reported by the LSL Acadata and Rightmove series. The same divergence is discernible between it and the ONS’s own quarterly series.

The UK HPI series is also a mix-adjusted index, which means that it is weighted to reflect annual changes in the mix and other attributes of the properties transacted.

The period with the base period for its price series is updated every five years, when the whole price series is rescaled to align with the new base period. Halifax also update their weights annually, while the Nationwide index updates its weights every two years.

To put it simply, mix adjusted indexes aim to report changes in average prices that take account of the changing composition of its source data of registered transacted dwellings, screening out possible distortions associated with outlier transactions, such that may arise with the sale, say, of highly valued properties.

The UK House Price Index (UKHPI) publishes UK HPI average house price estimates, associated indices and percentage growth rates down to regional and local authority level, according to property type, to buyer status (first time or former occupier), and to funding and property status (new build or existing).

The series thus offers greater granularity than do the other house price indices. Because it is based on all completed sales (rather than advertised or approved), including and cash and mortgage-financed purchases, it better reflects true house price trends, but with a backward-looking publishing lag.

National real house price trend since 1980

Annex Table Nine provides a time series between 1970 and 2024 for mix adjusted house prices across England, according to type of property, derived from that UK HPI series.

This table also offers a conversion of those cash prices into real (inflation-adjusted) terms.

A warning: the conversion of cash into real prices can be sensitive to the choice of deflator. Reported outcomes could differ if another conversion deflator was applied, such as the Retail Price Index, while, as explained above, the reported cash prices can vary substantially depending on the methodology and coverage of the index used.

Accordingly – as the case generally with house price indices – regard should be paid to trend variation rather than precise yearly figures conveyed.

Taking that on board, the main contours of the English house price story since 1980 can be broadly summarised thus.

  1. House prices in real terms were stable between 1980 and 1985, increased sharply between 1985 and 1990, before falling in both nominal and real terms between 1990 and 1996 – a period bookended at the start by a sharp recession in the early nineties that led to record levels of repossessions and negative equity; and at the end by the ushering-in of a period of low inflation, higher growth, and rising household incomes – sometimes called the Great Moderation.  
  2. By 2007, real prices had increased by a factor of between two and three. Cash or nominal prices during the 2000-2005 period exhibited an average annual percentage inflation increase of about 14% when annual inflation was around two per cent.
  3. The came the Great Financial Crash (GFC). House prices fell sharply in cash and real terms in 2008-2009, before recovering slowly in real terms by April 2014.
  4. Prices then the rose sharply again during 2015-2018, and 2020-22, before falling back slightly in real terms during the 2022-24 period, responding to rising interest rates and the cost-of-living crisis.  

Given the compilation and methodological issues briefly discussed above, the overall trend direction, as broadly summarised, should be taken as a guide with the average price levels reported for any year its conversion into inflation-adjusted constant price as indicative rather than precisely accurate.

Even more crucially, snapshots of house prices at any time point very much vary between regions and often areas (and sub-areas) within regions.

Country and regional trends

Table 6  reports average prices across the countries of Great Britian and by English administrative region, according to buyer (first time or former occupier) and property status (new build or existing), recorded by the UKHPI for April 2024.

It reports an average house price paid for all property types (taken as a proxy for all buyers) buyers in England of about £298,000 (nearest thousand), £158,000 for the North East, £203,000 in Yorkshire and Humberside, £375,000 in the South East, and £502,000 in London; £229,000 and £208,000 for Scotland and Wales, respectively.

With respect to the average price paid by first time buyers, it reported £250,000 for England, £136,000 for the North East, £175,000 for Yorkshire and Humberside, £299,000 for the South East, and £435,000 for London, and £153,000 and £180,000 for Scotland and Wales, respectively.    

Recent July 2024 data on lower quartile price non mix adjusted data also published by the ONS by indicates that in England that was £190,000, with lower quartile prices (price at the 25th point of the price distribution) ranging between £104,000 in the North East to £397,000 in London.

Table 6 also reports data on average prices paid for new and existing properties. The average reported new build price in England was £420,000 compared to £293,000 for an existing dwelling.

This new build premium of over a third appears surprising. This reported outcome is likely to relate to the compositional mix of new builds, and the tendency that they tend to be bigger in size and more likely to be detached at least in some regions (not London).

Such considerations underscore the need to treat headline house price data with caution, commensurate to the purpose of the inquiry.

The ONS provides an interactive guide to track average (estimated reported) house prices at the LA level in March 2024 (at time of writing, June 2024), by type of property.

A House of Commons Library dashboard, does so by single parliamentary constituency to neighbourhood level. It reports the non-mix adjusted median price paid for properties during the preceding twelve months on a rolling three monthly time series basis with latest reported at (at June 2024) for September 2023.  

Private rental levels

The primary source is the ONS’s private rental summary statistics series. This reports monthly rental prices for the private rental market in England according to bedroom category, by region and LA administrative area, calculated mainly from the Valuation Office Agency (VOA) data.

The ONS warns that that its source “samples are not statistical” and they should not be used to compare figures over time and between areas; nor do they include housing benefit (HB) claimants: a glaring omission insofar that 24% of PRS tenants according to the 2022-23 EHS were in receipt of HB.

The series reports lower quartile (the datapoint splitting the lowest 25% of rents from the highest 75%), the median (midpoint rent), and upper quartile (the datapoint splitting the highest 25% from lowest 75%), as well as recorded mean rent figures, for non-self-contained ‘room’, one bedroomed, two, three, and four bedroomed dwellings, for England, by region, across the 1 October 2022 to September 2023 period.

It is reproduced in Tables 6A to 6C for ‘rooms’ (bedsit-type accommodation as defined in note 1), one, and for three bedroomed dwellings.

The recorded median monthly rents for one bedroomed properties over that period for England, the North-East, the South East, and for London was £750, £450, £850, and £1,400, respectively.

For family sized three bedroomed dwellings, it was, £925, £600, £1,300, and £1,950, respectively.

These figures should be taken as a rough snapshot guide for the period in question.

They, of course, will also vary with area and neighbourhood; nor are they quality adjusted.  

Affordability and access (owner-occupation)

Another ONS dataset, using house price statistics for small areas (HPSSAs) derived from Land Registry recorded transactions, provides time series information on median house prices, earnings, and the median house price to median gross annual residence-based earnings affordability ratio, all by country and region (tables 1a to 1c),  by county (tables 3a to 3c), and by LA district (tables 5a to 5c).

Table 1c reports that the median house price to median gross annual residence-based earnings affordability ratio rose from 5.11 in England and 6.9 in London in 2002 to 9.06 and 13.62, respectively, in 2021, before subsequently slightly falling back in 2022 and 2023 as house prices dipped in response to increased mortgage rates.

The same ratio calibrated to the July 2024 ONS lower quartile series reporting the ratio of lower quartile house prices to lower quartile residence-based earnings, indicated a ratio in September 2023 of 7.25 in England, ranging from 4.32 in the North East,  to 13.1 in London, and 10.23 in the South East.

Such data does not report the affordability ratio for households who possessed sufficient savings or other resources (increasingly bequests) and income to purchase, nor the actual mortgage repayments of such households relative to their incomes, nor does it record properties sold at less than full market value.

They, accordingly, provide an indicator of the direction of affordability over time, but little about individual circumstances and access to home ownership for households with different circumstances, other than undoubtedly it has become much more expensive in general to purchase, relative to individual earnings.

Another House of Commons library (HOC) datasource using the ONS house price statistics for small areas series (HPSSA), reports house prices in each parliamentary constituency and the house price to earnings ratio.

It compares the median house price in each constituency (three-year 2020-22 average) with the median salary for full-time employees living there in each parliamentary constituency.

Fourteen London constituencies record a median house affordability ratio of more than fifteen. At the other end of the scale, eight constituencies report a median house affordability ratio of less than four, including Burnley, Copeland, Liverpool Walton, and Easington in England, and Blaenau Gwent, Rhondda, Aberavon, and Cynon Valley, in Wales.

As was earlier explained, the UK HPI is weighted to reflect the mix of properties sold in the previous year to make it broadly representative of the mix of properties in the overall dwelling stock.

The HPSSA, unlike the UKHPI, however, is not mix-adjusted, but uses rolling years to better reflect the actual mix of property sold.

As the UK HPI provides a measure of the changing market value of properties in the housing market whereas the HPSSAs measure the price paid for properties sold in each period, the two sets of statistics provide different figures, albeit exhibiting a similar time trend.

Unfortunately, the HPSSA series has been discontinued by the ONS and the final data available is for September 2022.

Another problem with all these measures is that earnings data is an incomplete measure of income, not taking account that many households have multiple earners, nor for the impact of other sources of income, such as benefits. At a local level, small sample sizes may aggravate variances.

Actual affordability ratios based on house price and mortgage advances data,  such as Table 44a of the 2024 UK Housing Finance Review,  reporting mortgage cost-to-income ratios for first-time buyers to the country/region level, indicate that the average ratio in England was 19.5% in 2022, while across its most expensive areas, including London and the South East, it registered between 20 and 21%.

The problem with such series – the converse to the one inherent with overall price to affordability ratios reported in the ONS datasets cited above – is that they only capture households that have been able to access and purchase through a mortgage a home, not those who were unable to access due to deposit requirements and/or unaffordable repayments whether by their own or lender decision.

The housing costs and affordability chapter of the 2022-23 EHS reported that the average (mean) deposit of a first time buyer in 2022-23 was £50,051 (£30,000 median), with 58% of such buyers coming from the top two income quintiles.

This piece of information helps to explain why 47% households in 2021-22 led by someone aged 25-34 were homeowners, less than the 59% recorded in 2003-4.

In 2021-22, 36% of purchasers reported receiving help from family or friends, while 9% used an inheritance as a source of deposit, a significant increase on the 22% of first-time buyers who reported help from family and friends in 2003-04.

89% of mortgagors reported in 2022-23 that they found it “very or fairly easy” to afford their mortgage, compared to 93% of mortgagors in 2021-22, with the proportion finding it “very easy” fell from 48% to 37%.  

However, an increased proportion of respondents reported a rise in some level of difficulty in affording repayments, with 9% of mortgagers finding it “fairly difficult” and 1% finding it “very difficult”.

The ONS has highlighted that monthly repayments on newly issued mortgages increased significantly recently in line with rising interest rates, noting that 1.4 million households in the UK faced the prospect of interest rate increases when they renewed their fixed rate mortgages in 2023.

Its map based affordability calculator indicates that purchasing a semi-detached property in the UK at the average December 2022 price of £286,000 would involve a monthly mortgage repayment of £1,262, assuming a mortgage term of 25 years: a £481 (61%) increase compared with the corresponding monthly repayment estimate in December 2021.

Purchasing the average detached UK property on the same terms in December 2022 would have resulted in a monthly mortgage repayment of £2,041 (up by 60.7% on December 2021).

For terraced houses, it would have been £1,063 (up by 59.6%). For flats and maisonettes, it would have been £1,028 (up by 54.6%).

In December 2021, a loan-to-value rate of 75% and a budget of £1,000 per month would have enabled a purchaser to afford an average semi-detached property in nearly two-thirds of local authorities in Great Britain.

With the same budget just one year later in December 2022, however, the same purchaser would have been able to afford the average semi-detached property in less than a third (30.1%) of areas.

Annex Table Two of the 2022-23 EHS, reported mortgage/rent as a proportion of household income for mortgagors and renters, resident for at least three years in 2022-23. 

That EHS table did not include housing-related costs, such as water and fuel bills, insurance, maintenance costs and council tax, were not included in that calculation. Income was taken to be the gross weekly household income with separate tables including and excluding benefits. Outright owners were excluded.

Two ratios were offered: one based on the household income (i.e. the income of all the members of the household, who are assumed to contribute to the mortgage); and the other based on the Household Reference Person (HRP) and their partner income only.

Between 2012-13 and 2022-23, the proportion of household income that mortgagors on average spent on their mortgage remained similar (19% in 2012-13 and 18.7% in 2022-23, according to the HRP plus partner measure).

Access and affordability: renters

According to the 2022-23 EHS, 59% (2.4 million households) of social renters and 24% (1.1 million households) of private renters received housing support (HB or the housing element of Universal Credit) to help with the payment of their rent.

A seminal June 2023 Institute of Fiscal Studies(IFS) study on renter housing quality and-affordability for lower-income-households reported that low-income households are increasingly private renters, renting relatively low-quality homes.

Younger low-income individuals today are more likely to privately rent than did older generations at the same age.

According to the same study, as at 2023Q1, just five per cent of private rental properties were affordable for housing benefit recipients.

Such properties were also more likely to have an energy rating of D or below, and on average have 19% higher heating and hot water costs. More generally they are more likely to be in low-employment and high-crime areas.

Moreover, most such tenancies are likely to be insecure and to suffer from quality issues. 

A 40% gross earnings rental affordability ratio, or more pertinently a 30% disposable income (including benefits) ratio may well push households further in poverty or into poverty, depending on individual household circumstances.

In that light, Annex Table Two of the 2022-23 EHS reported that for private tenants the average rental affordability was 40% (including housing support) and 46% (excluding housing support) relative to HRP plus partner income and for housing association tenants 30% and 38%, respectively (to nearest percentage points).

Although the 2023 Autumn Statement confirmed that Local Housing Allowance (LHA) will increase in April 2024 after having been frozen for long periods since January 2011, returning its coverage up to 30th percentile rent level, according to bedroom size, applicable to the local market area, making 30% of the market theoretically affordable to those reliant on housing benefit.

However, a recent Savills analysis of over one million Zoopla asking rents in 2023 showed that across Britain only 8.5% of such new listings would have been affordable using the new LHA rates.

The HoC datasource, using the ONS private rental summary statistics series, reports monthly private rents for two bedroomed homes, expressed as a proportion of monthly earnings, by LA area, for 2021-22.

Over 30 LAs, concentrated in London, reported a renter affordability ratio greater than 30.

Tables 6D-F  drills down on the ONS private rental summary statistics series.

It calculates monthly/annual gross incomes consistent with an arbitrary 40% affordability benchmark relative to room, one bedroomed and three bedroomed lower quartile rents, by region.

That an annual gross income according to that yardstick was required in London of £19,500, £35,100 and £49,500, respectively, for the period ending September 2022, suggests that the problem of affordability endemic for low-income households in the capital is both concentrated and endemic.

A more up-to-date and forward looking source is an ONS ‘statistics in development’ dataset on new renter affordability.

This estimates the proportion of actual gross earnings taken by rent paid by individual renters, starting new tenancies during the reported months up to May 2024, excluding guarantors, or individuals with very low incomes who are likely supported by another income source or whom have very high incomes that could skew the results.

The ONS advises that these reported estimates “reflect affordability at snapshots in time and are therefore not precisely comparable over time although the large sample size, covering around 30% to 40% of all rentals in the UK, ensures that the time series is useful”.

In May 2024, the proportion was 28.2% that month compared with 25.2% in May 2021. That estimate was an average, which, as ever, will mask variations, some of which will involve individual renters paying a higher proportion. It will exclude potential renters ‘priced out’.   

Summary and policy implications

This section identified a range of issues relating to the reporting of house prices and their affordability measures. It advised that attention should focus on the broad direction of direction and its regional/area differentiation rather than on short term headlines and precise figures, which, are always averages, if not estimates.

The assessment of affordability is particularly problematic. One common yardstick is that the maximum rent or mortgage payment should not exceed a third of after-tax household income or 40% of pre-tax income, as was employed above.

Some measures include other housing costs, such as utility and heating costs; and others don’t, and sometimes exclude housing benefit (HB) claimants, and 40% or whatever of household income, however, defined, differs in impact with income.

A feature common to both buying with a mortgage and renting affordability metrics is that taken across the board is that they can suggest affordability.

That conclusion is bedevilled, however, by the reality of the ‘priced out’ generation and ballooning levels of homelessness, often linked to insecurity and lack of access to, and unaffordable rents prevailing in the PRS, relative to individual circumstances.

Those able to buy, and to a much lesser extent, to rent in the PRS, are, by definition, self-selecting, insofar that they have managed to surmount the hurdles to entry, whether through their individual household circumstances and/or increasingly through being able to access family financial support.

The clear ensuing implication that follows, of course, as is well known and incessantly advocated, is a greatly expanded supply of affordable housing, especially let at SR levels.  

True, but this website worries that this is unlikely to be achieved anytime soon for a range of reasons touched on throughout this post and is easy to proclaim rather than activate and that in the unbounded meantime more extensive, granular, and concerted measures are needed.

It also rather suggests a bifurcated housing system with SR catering for those unable to purchase and able to qualify for it, with the remaining majority left to access the private speculative market.

In the absence of wider strategic cross tenure reform, the housing double binds that so mark the English housing system will continue to get tighter.

To take just one salient example, any dependence by the new Labour government on the private sector to achieve its delivery target, presupposes rising house prices to deliver required profit incentives and to maintain S106 cross subsidies within a constrained fiscal environment.

But that outcome will itself undermine access and affordability, especially to those wishing to become homeowners but with moderate and less secure incomes, while bestowing continuing greater wealth (and ability to assist offspring with their purchases on established owners, especially in high value/need areas: a self-perpetuating process, entrenching societal inequalities.

Share this:

  • Click to share on X (Opens in new window) X
  • Click to share on Facebook (Opens in new window) Facebook
  • Click to print (Opens in new window) Print
  • Click to email a link to a friend (Opens in new window) Email
  • Click to share on WhatsApp (Opens in new window) WhatsApp
  • Click to share on LinkedIn (Opens in new window) LinkedIn

Filed Under: Housing Tagged With: housing, housing supply, lettings, statistics

The CMA Housebuilding Study: Labour’s blueprint?

31st March 2024 by newtjoh

This extended post summarises and critically reviews the Housebuilding Market Study (the Study) that the Competition and Market Authority (CMA) published this February. This concluded that the housebuilding market in England, Scotland, and Wales is failing consumers and has consistently done so over successive decades, delivering outcomes falling well short of what a market working well should do.

Wider lessons are drawn from both the Study’s analysis and shortcomings to focus on the actions that a new Starmer-led United Kingdom (UK) government should put in hand within its first few weeks of office if it was serious in intent to achieve Labour’s proclaimed commitment to build 1.5m. additional homes during the lifetime of the next parliament in England (an average annual total of 300,000).

 Section One provides background to the process, defining the Study’s diagnosis of housing market failure taken from both the published final report and supporting evidence documents against the metrics of supply and affordability, the quality, innovation and sustainability of the delivered product, and the profitability of the 12 largest housebuilders.

Its main decisions on future actions, including the recommendations to government made concerning the future private management of public amenities on housing estates and on future consumer welfare, protection, and information outcomes are noted. Appendix A records those recommendations.

Section Two delves deeper into the causes and consequences of the wider market and the institutional failures that the Study identified, with reference to the operation of the planning system and the speculative housing model and its associated low build out rates.

The options it identified for government to consider while taking account of wider policy and other trade-offs, as well as other possible areas of government intervention that to improve outcomes across the planning and the speculative housing system and associated build out rates are discussed. Appendix B catalogues these options.

Section Three points out that the Study, like many housing policy commentaries, conveniently neglect the key political economy parameters of housing policy that need to be understood and addressed for real progress to occur.

These include the real fiscal crisis of the state, Nimbyism and related issues of local democratic preference versus the central compulsion required if set central government objectives are to be attained, lack of institutional capacity at both central and local levels, and political short-termism and the related lack of effective governmental focus on, or any real intent to achieve proclaimed objectives, most notably the overarching 300,000 supply target (the target).

Section Four points out that development timescales and almost certain substantial under-supply in 2025 mean that planning approvals and housing starts must begin their substantive upward trajectory no later than 2026 if the target is not to prove an early ‘dead duck’ or an example of ‘wishful verbiage’ for the new government, as it has proved for previous governments. It outlines an initial route map on how a new UK government could at least hit the ground running in its initial weeks in the light of that imperative.

It also demonstrates that the target cannot be achieved without a substantial step increase in the share of total supply taken by affordable and other forms of housing delivered outside the speculative model.

This – as will the enabling of New Towns and other large scale urban extensions – will require additional public investment. The 2025 Comprehensive Spending Review treatment of that investment requirement will thus provide an early and determining litmus test as of the practical application of Rachel Reeve’s fiscal rules and their positive relationship to wider macro-economic and strategic political goals.

1             Process and Diagnosis

The Competition and Markets Authority in February 2023 launched a Market Study (MS), under its Enterprise Act 2002 statutory powers, into the supply of new homes to consumers (‘housebuilding’) in England, Scotland, and Wales.

Under that Act, such a MS can be a self-standing piece of work or, where reasonable grounds for suspecting “that a feature or combination of features of a market or markets in the UK for goods or services prevents, restricts or distorts competition” are found, it can lead to a further market investigation reference (MIR), which can then culminate in the imposition of fines or other remedies on identified firms.

In November 2023 working papers on the  Private management of public amenities on housing estates, land banks, and the planning system(s). were published.

The  final report (the Study), alongside other supporting material including a supporting evidence document, was published on the 26 February 2024.  It concluded that intervention in the housing market was required for it to deliver better outcomes, across three main areas:

  1. More homes overall, and particularly in the areas of highest demand, in turn reducing pressure on affordability;
  2. Consistently better outcomes on new build quality, with consumers having an effective route to redress; and
  3. Reduced detriment to consumers arising from the private management of amenities on new build estates.

The CMA, however, decided against making MIR references regarding the existing private management of public amenities (estate management) or the land banking arrangements it had examined in detail.

With respect to estate management, it concluded that direct government action would provide a more appropriate and comprehensive response to the consumer detriment the Study identified as occurring, as well as its future prevention.

Specific policy recommendations (see Recommendations 1.1 to 1.5, Appendix A) were made aimed at preventing the future proliferation of private management arrangements on new housing estates and to provide greater protection to households living under such existing arrangements.

It further invited the United Kingdom, Scottish and Welsh governments (GB governments) to also consider options to support the adoption of public amenities on estates currently under such private arrangements.

The Study also made specific recommendations to governments to improve quality and redress routes for consumers and purchasers of newly built housing (Recommendations 2.1 to 2.6, Appendix A.

These specific recommendations were made across both the above areas, because better market outcomes could be obtained “within the current broad market framework and (they) which do not involve significant trade-offs with other policy objectives which are outside the scope of the CMA’s study and which would involve wider political choices”.

With respect to land banking, the Study found that their size and operation reflected wider market and institutional failures, namely the operation of the planning system and the speculative private housebuilding model alongside related incentives driving the speed of private speculative build out.

These wider failures, it concluded, would be better addressed through government action focused on those areas, (see section 2 below) rather than through remedial measures made specifically to reduce the size of landbanks, as these taken in isolation would most likely reduce housing supply.

However, on the back of evidence uncovered by the Study that suggested that some housebuilders may be sharing non-public information on sales prices, on incentives, and on rates of sale, the CMA did decide to launch an investigation under the Competition Act 1998 into such suspected conduct by Barratt, Bellway, Berkeley, Bloor Homes, Persimmon, Redrow, Taylor Wimpey, and Vistry, “given that it may have the object or effect of preventing, restricting or distorting competition”.

In March it announced that (outside the Study) it would commence a preliminary investigation into the proposed merger of Redrow and Barratt.

Supply and Affordability

The Study linked together two crucial facts that:

  • Housing supply has persistently fallen well short of successive government targets, “compounding over time to create a growing housing shortfall”; and,
  • Housebuilding has only previously reached the current 300,000 dwellings target (in England during periods where “significant supply was provided via local authority building”. Final report Figure 3.2 provides a useful annotated graphic illustrating that historically fundamental outcome.

The achievement of an additional annual supply of 300,000 is also the opposition’s target consistent with Labour’s commitment to build 1.5m homes over the lifetime of the next five-year parliament. The Welsh and Scottish governments have not hitherto set a headline total new supply target.

As Table 1, instructively, shows, the highest annual new supply (total net additions) figure recorded since 2006-07 (when the most accurate and comprehensive official housing statistical series to measure new completions and net additions in England began) was c248,500 dwellings in 2019-20: 83% of the 300,000 annual target; more pertinently, the annual average total supply across the entire 2006-23 period was c195,000 dwellings, c64% or less than two thirds of the proclaimed target.

The table also demonstrates the further substantive (albeit well known) point that the Study went on to make that new supply is also highly cyclical and prone to sharp fluctuation: the 2010-11 low point figure was barely half of the latest 2019-20 peak, as cited above.

Explaining this, the Study reported that most new homes are delivered through the private ‘speculative model’ of housebuilding for profit, where housebuilders buy land in advance of the construction and sale of homes without knowing the final price at which they will be sold.

Overall, according to the Study, around a half of GB homes are built speculatively, and a third on an affordable housing basis, sold or rented at a discount to market price; self- or other custom-built and build to rent completions account for the remainder of the total (noting that data on the tenure breakdown of completions is less accurate than total new supply data (DLUHC), certainly in the case of England.

In England, however, (less during market downswings, more during upswings) around 60% of new builds are produced through private speculative model. Scotland and Wales produce relatively more affordable housing, 45% and 50% of total new build supply in 2021-22, respectively, compared to around the 29% share that it takes across England.

The Study went on to highlight that this model produces too few houses, especially in the areas in which they are most needed, consequently, “exerting associated effects on local affordability and overall consumer welfare outcomes”.

“Significant variation in housing delivery relative to need” also occurs across both countries and regions, with Scotland in recent years coming closer to meeting its implied target levels than has England and Wales.

London, the South East, and the East regions (administratively defined) account for the majority of the areas exhibiting “significant under-delivery against assessed need”. All LPAs in the East of England, South East, South West, and London regions have an affordability ratio of five or higher.

Housing need is defined by the Study as “the amount of housing required for all households to live in accommodation that meets a certain prescribed standard (which irreducibly involves political judgement as to the acceptable standard)”.

This is a normative standard that invariably results in a higher figure than the 300,000 target. For instance, a 2019 Study (Bramley or Heriot-Watt Study) for the National Housing Federation (NHF) and Crisis found that around 340,000 new homes need to be supplied in England each year, of which 145,000 dwellings should be affordable.

A February 2024 Financial Times (FT) analysis  (not reported in the Study) that used the Heriot-Watt University methodology referenced above, but updated it with the latest (Office of National Statistics (ONS) population data and with net migration projections from Oxford University’s Migration Observatory, found that c421,000 additional homes were needed to be provided annually until 2036, assuming that average annual net migration to England figure will hover around 345,000 over the next 15 years.

On the other hand, the Study also cited an analysis (Study link broken, but summary by Ian Mulheirn can be found here) that argued that UK housing supply has outstripped household formation (for decades and that house price increases are a function of the main components of the cost of capital: mortgage interest rates, taxes, and expectations of future price growth.

Indeed, since the late 1990s, mortgage rates tumbled, with inflation-adjusted interest rates on five-year fixed-rate mortgages, for example, falling from 8% to around 2% which given that mortgage interest rates tend to be the dominant element of the cost of capital for homeowners, largely explaining the substantial increase in house prices experienced since 1996.

It is relevant to note in that regard that a seminal 2019 Bank of England working paper concluded that the rise in house prices relative to incomes between 1985 and 2018 can be more than accounted for by the substantial decline in the real risk‑free interest rate observable over that same period and that changes in that rate “were a crucial driver in house price changes”.

Ian Mulheirn’s study went on to posit that the housebuilding target of 300,000 would only result in a 10% decrease in the affordability ratio over 20 years. It would neither solve problems of high house prices nor low home ownership, but instead likely to result in further growth in the number of unoccupied (and under occupied?) homes, “which may not be an efficient use of scarce investment capital”.

Alternative policy solutions that it suggested included building more social housing or more generous housing benefit, “as these policies would help affordability-constrained young people”.

The CMA Study concluded that even a highly competitive private housebuilding market (which it showed did not exist) will not, on its own initiative, produce sufficient housing to meet overall housing need in accord with its wider (external) benefits (boost to productivity, education, health, and other outcomes) to society.

And, while private housebuilder incentives to build are likely to follow changes in demand, how well the housebuilding sector is delivering for consumers and wider society “is likely to be better captured by how far it is delivering against housing need”.

The CMA accordingly decided to focus on assessing supply delivery against housing need in its supply analysis (para 2.6, further evidence document).

Turning to housing demand, this, according to the Study, is determined “by the number of people or organisations willing and financially able to buy a property, either as a home, second home or investment property”; an outcome patterned by disparate factors, including aspiring buyers’ ability to sell their existing home, their access to housing equity or a deposit, their access to credit and the price of that credit (effective demand is interest-rate sensitive where prospective purchasers rely upon mortgage finance to proceed), their current income and future expectations, as well as the financial and tax implications of property ownership, their expectations of future returns, and wider market sentiment.

People will also often choose to purchase more housing when their incomes allow, for example, taking on properties with spare rooms or buying holiday homes. Thus, as real incomes increase, it can be expected – other things being equal, which, of course, they will rarely be, as above – that housing demand will expand proportionately more.

Because all these factors are constantly changing and are strongly linked to general macroeconomic performance, housing demand will fluctuate, making it difficult to measure.

In addition, buying, selling, and even moving house are all time-consuming and difficult endeavours involving high time and other transaction costs, including residential stamp duty, estate agents’ fees, removal, and reconnection costs, etc.

Consequently, people may not adjust their individual demand for housing immediately as their circumstances change.

The Study went on to posit that “although affordability is determined by factors such as household size and composition, credit conditions (including interest rate changes, presumably), population growth, and levels of household income”, if the supply of housing fails to keep pace with changes in demand, house prices can be expected to rise faster than earnings, so worsening affordability.

This the Study defined as “the level of housing outgoings (for rent, mortgage, etc.) which a household can (and will) meet from its recurrent income without significant risk of material hardship or financial stress, including the risk of being pushed into poverty”.

It has certainly worsened over time. A key ONS dataset reports that the median house price to median gross annual residence-based earnings affordability ratio rose from 5.11 in England and 6.9 in London in 2002 to 9.06 and 13.62, respectively, in 2021, before subsequently slightly falling back as house prices dipped in response to increased mortgage rates.

The Study itself reported that by 2022, full-time employees in England could expect to spend around 8.4 years of income buying a home, compared to 6.4 in Wales, and 5.3 in Scotland, noting that as rough rule of thumb, it should lie in the four to five range (mortgage lenders, for example, seldom lend more than 4.5 times of purchaser annual income).

Considerable variation within countries and regions (as well as between – exemplified by the London figures reported above) also occurs. All regions (except the North east) have LPAs in 2021 with affordability ratios of over five (see figure 2.4, CMA Supporting evidence document for an annotated and illuminating infographic defining the most and least affordable LPAs within each country and region. You could purchase then homes in Merthyr Tydfil, Barnsley, Copeland, Bolsover, County Durham, Copeland, and Stoke-in Trent, LPAs reporting an affordability ratio of less than five).

The Study pointed out such entrenched variation is likely to be symptomatic of a market that in supply response is unable to adequately adjust to consumer preferences, expressed through price signals, concerning the supply of available homes and their desired locations.

With respect to rental levels, the Study reported that the rental affordability ratio for both England and Wales since 2014 taken across the board has remained below the affordability threshold of 30% of income, used by the ONS as a normative yardstick.

More instructively, however, when lower quartile income (the income that 25% of households are at or below) are compared with the lower quartile rent (the rent that 25% of rental properties are at or below),  the ONS found that at a country level, in England and Wales, high, average, and low rents were all above the ONS’s affordability threshold and thus unaffordable for lower income households; and that they were only affordable for average-income households in Wales. In England only average and low rents were affordable for average-income households.

Quality, innovation, and sustainability

The Study recorded a lack of competitive pressure to drive up new build quality, related to factors both intrinsic to the characteristics of housing as a good and to specific shortcomings in the consumer regulation and oversight of the housebuilding market.

Intrinsic factors include that new build quality is difficult or impossible to observe prior to purchase. It becomes noticeable to purchasers only when something subsequently goes wrong. In that sense, the speculative housing market suffers from a similar market information failure or imbalance as does the second-hand car market – something the Study did not highlight.

Connected to that, prospective buyers also prioritise factors other than quality (which, as above, in any case, is difficult to observe or assess) as they hurriedly compete to complete a purchase in accord with their budget constraint and preferences and not to miss out on their hopes.

During this process they can fear that they will otherwise ‘miss the boat’ and be priced out (especially during periods of robust house price growth),  making them even more amenable to the assumption that housebuilders build to a baseline level of quality  – a reasonable one given the nature, importance, and expense of the good, when considered alongside associated seller publicity, which is often unclear and sometimes misleading (another information imbalance or failure).

The Study was clear that such information imbalances have not been rectified by the current voluntary consumer protection arrangements. It singled the House Builders Federation (HBF) Star Rating Scheme for criticism as of limited informational value, one which was not designed in the first place to ensure effective and timely rectification of defects.

Evidence of consumers encountering increasing and mounting difficulty and housebuilder resistance found by the Study when multiple number of snags or faults remain to be rectified, with a small but significant minority experiencing the most serious defects suffering significant consumer detriment: a serious matter and market failure for the most important purchase that most people make in their lives in terms both of their financial commitment and their individual/family future and welfare.

Levels of innovation in the industry were also found by the Study to seriously undershoot what it considered a dynamic, well-functioning market should foster and generate, noting that despite the largest housebuilders investing in, acquiring, or developing their own more innovative production capacity its dissemination continues to be slow, while sustainability efforts are primarily driven by expectations of future regulation, rather than endogenous (self-driven) industry momentum.

Profitability

The Study found that the profitability of the 12 largest housebuilders, delivering around 40% of total housing completions in recent years, exceeded what it would expect a well-functioning competitive market to provide, at least during “periods outside the Global Financial Crisis (GFC) and its immediate aftermath”.

That conclusion was based on a methodology predicated on the assumption that in a competitive market, a ‘normal’ profit was “the minimum level required to keep the factors of production in their current use in the long run: i.e. when the rate of return on capital employed for a particular business activity would be equal to the opportunity cost of capital for that activity”.

The rate of return that housebuilders achieved on their employed capital accordingly was compared to the opportunity cost of that capital between 2003 to 2022 inclusive.

Housebuilder profits from 2013 to 2019 were found by the Study to be particularly high against that ‘normal profit’ yardstick, because of supportive economic circumstances for housebuilders – in particular, low interest rates and quantitative easing – as well as by measures taken by the government to help homebuyers fund deposits for the purchase of new homes through the Help to Buy (HtB) scheme.

The Study highlighted that one large housebuilder, following the changes to the planning regime in 2012 was able to build out the strategic land bank it held at the time, thereby realising the greater returns associated with buying land without planning permission, before it then benefited significantly from increased HtB-driven demand; c60% of the homes sold by that housebuilder in 2018 were supported by that scheme.

Specifically, it (Table A:1) computed that during the 2016-19 period inclusive the return on capital employed (ROCE) achieved annually by the 12 housebuilders was between 29% and 34%, whereas its mid estimate (Table B.4 of Appendix B) of their pre-tax nominal annual cost of capital was between 14.4% and 14.6%: the observed profit of the largest housebuilders was thus double their expected ‘normal’ profit.

The Study had earlier confirmed (para 4.105, planning working paper, see link above) that, typically, housebuilders expect to achieve margins in the range of 15% to 25% on residential development sites, equating to approximately £46,000 to £77,000 per plot at average house prices.

It still concluded, nevertheless, that specific intervention (s) is not required to tackle such excess levels of observed profitability directly, as such intervention, according to the Study “could create an additional downward pressure on the number of houses being built, exacerbating the supply problems that have characterised this market over a long period”, because:

  • the housing market is highly cyclical and is impacted by external factors, including the wider economic climate;
  • profitability during the 2010s is likely to have been boosted by supportive economic circumstances and temporary factors no longer in evidence, in particular a prolonged period of low interest rates and the Help to Buy schemes’ support for first-time buyers;
  • there was significant variation in the performance of individual large housebuilders in the Study sample.

 2             Causes and consequences of housing market failure

The Study found that deficient housing supply and its affordability was propelled by, in effect, two (and a half?) key drivers:

  1. The nature and operation of the planning system;
  2. The limited amount of housing built outside the speculative approach (such as affordable housing, self-build, and build-to-rent), with private speculative build-out rates providing an additional (related?) factor insofar that it is both cyclical and calibrated to avoid impacting on market prices.

 Operation of the planning system

Insofar that a prior condition for building houses is possessing permission to build them, the Study found that the nature and operation of the planning systems is a key driver of the under-delivery of new housing at levels required to meet government targets and measures of assessed need.

That the number of planning permissions granted over the last 10 years across GB, and particularly in England, have been “insufficient to support housebuilding at the level required to meet government targets and widely accepted measures of need” was highlighted, with the number of units granted planning permission in England in 2022-23 falling to 269,000 after several years when permissions had exceeded 300,000.

The Study pointed that due to some applications lapsing because of viability or other reasons and the time lag between when a scheme is approved and when it is built out, achievement of the 300,000 target requires the number of applications approved each to exceed 300,000 to allow enough permissions to be banked over time consistent with the delivery target.

More broadly, the ability of the planning system(s) “to support the level of housebuilding that policymakers believe is needed”, is limited by its:

  • lack of predictability;
  • length, cost, and complexity; and the
  • insufficient clarity, consistency and strength of LPA targets, objectives, and incentives to meet housing need.

These problems, the Study added, may have a disproportionate impact on Small and Medium Enterprise (SME) housebuilders.

Four potential sources of unpredictability in the planning system were then pinpointed.

First, governments frequently use the planning system to implement new policies, most commonly environmental regulations resulting, in effect, administrative and policy overload on LPAs with limited resources causing consequent delay and confusion. Examples provided by the Study included nutrient neutrality requirements and biodiversity net gain rules in England.

Second, since the introduction of the National Planning Policy Framework (NPPF) in 2012, significant revisions have become more frequent in recent years, with the review process that starting with the 2020 Planning White Paper generating particular policy uncertainty at LPA and other stakeholder levels.

The most recent and, perhaps, notorious example was the December 2022 consultation on revisions to the NPPF, which, as this website in  and others warned would happen, has led some LPAs to delay or to even withdraw their Plans, and/or rescind previous application approvals.

The Levelling Up Secretary of State Michael Gove in a December 2023 Ministerial Written Statement announced the result of the government’s response to that consultation, in parallel publishing an updated National Planning Policy Framework reflecting the changes made.

In summary, the new 2023 NPPF, according to the government, is designed to: facilitate flexibility for local authorities in relation to local housing need, with the Standard Method (see below) for calculating housing need becoming an “advisory starting point” rather than a mandatory input for LPAs in their determination housing numbers; clarify a local lock on any changes to Green Belt boundaries; safeguard local plans from densities that would be wholly out of character; free local authorities with up-to-date local plans from annual updates to their five-year housing land supply and remove buffer requirements, save that a 20% buffer  will still be applied if Housing Delivery Test targets are not met; limit the practice of housing need being exported to neighbouring authorities without mutual agreement; bolster protections from speculative development for neighbourhoods that develop their own plans; support self-build, custom-build and community-led housing; and cement the role of beauty and placemaking in the planning system.

The 2023 NPPF also retained the 35% uplift to the assessed housing need for the 20 largest towns and cities in England and the requirement that it should be accommodated within those cities themselves, except where cross boundary redistribution agreements are in place.

According to the Study, the uncertainty arising from this latest review process have yet to be resolved, with many changes proposed to be rolled out gradually on a ‘test and learn’ basis.

Although it did not highlight introduction of the Infrastructure Levy (IL) by LURA that measure provides a prime case in point of planning reform generating confusion and uncertainty with its associated ‘test and learn’ issues risking potential and substantive future policy planning blight, as this website in Going around the Mulberry Bush  discussed in detail.

In February 2024, the UK government announced further changes focused on encouraging brownfield development, including a new consultation on changes to the NPPF involving introduction of a presumption in favour of brownfield residential development where a LPAs HDT result is both below 95% and it is one of the 20 LPAs in receipt of the 35% urban uplift, and a change that would expect all LPAs to give significant weight to the benefits of delivering as many homes as possible, and to be flexible in applying policies or guidance on the internal layout of developments, especially again in relation to brownfield land proposals.

There have also been significant recent changes in Scotland and Wales over the past few years.

Third, there is a lack of up-to-date Local Plans (LPs), especially in England, where on 31 December 2021, less than 40% of LPAs had updated their plans in the last five years. 22% had not either adopted a plan for more than 10 years or had no plan in place.

Updating a plan is a complex and lengthy process, with DLUHC estimates suggesting that the average time taken to produce a local plan is seven years involving substantial time and other resource costs.

The Study was told by some LPAs told us that they had difficulty getting plans adopted for political reasons, especially where the plan might require the release of green belt land to meet housing need, with analysis presented showing that the LPAs with either a significantly outdated plan, or no plan at all, typically have much higher percentages of greenbelt land within their boundaries (see Table 6.8, further evidence document).

The Study advised that LPAs with out of date or no plans  tend to the same ones that undershoot their Housing Delivery Test (HDT), (Table 6.5, further evidence document). The presumption of sustainable development ceases to apply to speculative applications where an LPA is not delivering more than 75% of its assessed housing need target, as it does where the LPA’s LP is out of date and/or where it cannot demonstrate a five-year housing land supply (5YHLS), subject to the changes made in the 2023 NPPF.

As way of background, the 2018 updated NPPF introduced both the centralised Standard Method (SM) to assess housing need and the HDT.  The SM is a baseline formula used to identify the minimum number of homes expected to be planned for in a way which addresses projected household growth, affordability and, in some cases, any urban uplift required by the 2023 NPPF.

It identifies a minimum annual housing need figure to be used in the HDT, not a housing requirement figure, which the individual LPAs are expected to define themselves.

HDT targets cover a three-year period with specific values set and calculated for each year, based on the lower of either the need level set out in an up-to-date Local Plan (LP) or the SM assessed need level. Where the LP is not up to date, as is the case for the majority of English LPAs, the HDT should assess local delivery against the local SM assessed need figure.

In short, significant underperformance of housing delivery against targets is limited to a relatively small number of LPAs, relatively highly concentrated in certain areas of the country, particularly in the South East, the East of England, and the London regions.

The Study cited its own analysis that 51 out of more than 306 LPAs (17%) in England achieved less than 75% of their need based HDT targets in 2021, whereas 214 (or 70%) of LPAs achieved more than 95% of their housing need.

The majority of the areas that achieved less than 75% (37) are located in the South East, East of England and London, with LPA performance in the HDT remaining broadly consistent since 2018 (see Table 6.1, further evidence document). The above, of course, are the same areas where supply deficiency and affordability problems and the population are most concentrated (see section 1).

The Study further found that LPAs with the highest delivery against their housing targets tend to process a higher number of applications relative to their housing stock; approve a higher proportion of those applications; have a lower proportion of their rejection decisions appealed; and lose a lower proportion of appeals, with converse being the case for LPAs with the lowest delivery against their housing targets.

Fourth, political and public attitudes to development are frequently expressed through the planning process. Residential development has become increasingly politically contested, delaying, and making harder timely Local Plan making and planning application determination, to the point that development applications and investment are discouraged.

The Study did, nevertheless, find that the strongest existing sanctions for LPAs to prioritise housing delivery exist in England, where a presumption in favour of sustainable development (due to the NPPF) comes into play if targets are not met. Housebuilders therefore have greater rights to have applications approved, compared to Scotland or Wales, where no equivalent incentive is in place.

Protected land or geographic constraints can undercut that presumption, however. Across many areas of England (footnote seven of para 66, NPPF), designated local green spaces, areas of outstanding natural beauty, national parks, heritage coast, irreplaceable habitats, heritage assets (and other heritage assets of archaeological interest), and areas at risk of flooding or coastal change, as well as designated green belt land are specifically excluded from the presumption.   The North West of England (53.1%) and the South East of England (49.6%) have the highest proportion of protected land in England

 The Study went on recognise that when all is said and done the planning system(s) was and is in large part designed to ensure that local preferences are incorporated into decision-making – adding the cavil that this does not necessarily lead to consistent decision-making at a local level.

Given that and “the wider policy trade-offs and complexities that are inherent in planning system design and operation”, the Study decided that it would be inappropriate for the CMA to make specific recommendations to governments about how such trade-offs should be made.

Rather, given “the vital role that (planning systems) play in shaping market outcomes” it offered options to make them more predictable and less costly, lengthy and complex for housebuilders.

But it left it up to governments to “consider whether the (associated) trade-offs with wider policy objectives are worth making, in the context of their overall objectives for the housing market”.

These are set out in Options 2.1 to 2.7, Appendix B.

To give a flavour of these planning options, Option 2.1 defines the features that would mark an effective methodology more likely to result in a local target that accurately reflects need:

  • ease of understanding – ensuring that the assessment of housing need is easily implementable and has results that are readily understood, will allow for national and local targets to be more readily accepted and outputs to be more easily disseminated;
  • using reliable evidence – using up-to-date and robust evidence will ensure that the target will more closely reflect current housing need. In addition, using evidence from credible and, where possible, publicly available sources will help ensure that the results are more easily understood and accepted;
  • regular assessment – regular calculation of the housing target will help to ensure that the target is as accurate as possible; noting, however, that LPAs need a degree of stability in the national target so that they can effectively plan to deliver their local housing target for the medium and long term. Updating the target too frequently could lead to increased uncertainty at a local level, as well as the national and local target losing credibility. To achieve the right balance, the target could, for example, be updated whenever updated national household projections are available, but no more frequently than this;
  • unadjusted outputs – noting that housing policy is a matter for governments and incorporating aspects of policy targets, such as brownfield land use, may be an appropriate way of achieving policy aims. However, reducing the incorporation of other policy aims in the methodology through adjustments will result in the target becoming less reflective of underlying housing need. Therefore, such adjustments should be kept to a minimum with limited scope for discretion for the governments in making such adjustments.
  • local alignment with national target – limiting local deviation from the agreed methodology will result in local targets that are more closely aligned with the national target.

Appendix B should be consulted for detail on the other options that the Study presented.

Wider operation of the speculative housing system and associated build out policy issues

The Study largely echoed the Letwin Draft Report analysis in concluding competitive pressure to supply homes at a rate that exceeds the current local absorption rate was weak, “limiting the number of homes that are built over a period, removing potential downward pressure on local prices”.

Letwin’s investigation into 15 very large sites in areas of high housing demand found that their median build out period from the moment when the house builder has an implementable consent is 15.5 years; or put another way, the median percentage of a site built out each year on average through the build out period is 6.5%.

It pointed out that across the large sites of over 1,500 dwellings that it examined the revealed market absorption or build out rate went on to limit the corresponding scope to provide cross-subsidies between the units sold at market values and the affordable dwellings, consequently retarding the rate at which housebuilders can and will build out the affordable housing that may be required by any applicable affordable housing Section106 (S106) agreement.

The CMA Study put forward Options 2.8 to 2.10, Appendix B to support a higher build out rate.

Under Option 2.8, LPAs could require increased diversity of tenure for larger sites to be granted planning permission, including raising the proportion of affordable, build to rent or custom build homes on sites.

Increasing the wider diversity of housing tenures (sub-tenures?) aimed at different sub-segments of the market, could consequently allow for more homes to be absorbed within the local market “without housebuilders needing to reduce the prices of the housing they produce for the private market, thereby improving the speed of housing delivery”.

LPAs could also publish their policy on housing tenure requirements, meaning that they are known by housebuilders and reflected in land transactions.

Such a requirement could be decided and operated in a similar way to LPA policies on affordable housing and developer contributions. The Study noted that the Letwin Final Report recommended a similar measure for developments providing over 1,500 dwellings, not then taken forward by the UK government.

With Option 2.10, LPAs could require housebuilders to increase the diversity of the types of homes (type, size, style, design, rather than tenure?) that they build on larger sites.

Sites with greater diversity of types may build out more quickly “as the varying types of homes entering the market are more likely to appeal to different sub-segments of the market and therefore such sites are less constrained by the local absorption rate”.

It went on to caution that were to support a higher build out rate the UK, Scottish, and Welsh governments to pursue these options that they should pay regard to the following considerations:

  • requirements for housebuilders to deviate from the profit-maximising level of site diversity could impact on viability and the number of sites developed;
  • to build a greater amount of affordable housing would likely require additional public funding, as such housing is sold to registered providers who are, at least in part, funded by government grants;
  • as with obtaining developer contributions, site diversity requirements must be consistent and not complex, as this would increase uncertainty and create delays in the planning process.

The Study concluded, however,  that whilst housebuilders could increase the rate at which they sell speculative homes by offering them for sale at lower price, as the number of homes that housebuilders can build (and therefore sell) in an area in the short to medium term is inherently limited by the planning system, “lowering their prices is more likely to bring sales of these homes forward in time, rather than increasing their overall sales over the medium term”.

Once a housebuilder has built out and sold the homes it has planning permission for in an area, it cannot simply sell more homes. To increase sales further a housebuilder must first obtain additional planning permissions, which, as the Study reiterated, is a lengthy and risky process, meaning that over the longer-term, “supply will depend on the extent to which they can get hold of further land with planning permission in the area”.

Yet, its overall conclusion was even if policymakers made the changes the Study proposed (as set out in Appendices A and B) “the market may still fall short of delivering the quantity of homes, supporting a level of affordability”, that policymakers find acceptable” because:

  • market outcomes are heavily influenced by external factors, such as interest rates, mortgage availability, the rate of new household formation, by demographic change and by the level of household incomes; and
  • market cyclicality and the speculative housebuilding model means that private housebuilders do not collectively have the necessary incentives to build houses at the rate required to meet policymakers’ objectives.

The Study went to say while it is open to policymakers to deliver change through more fundamental interventions “that go beyond the way in which the market itself works but would have a significant impact on the quality and affordability of new homes being built”, such interventions often come attached with “fiscal and policy implications”.

It accordingly declined to offer recommendations or specific policy options, but did identify areas of potential intervention because, “without them our analysis of this market and the potential outputs it can deliver would remain incomplete”.

These covered the encouragement of non-speculative housebuilding models, including self- or custom-build homes.  CMA, therefore, looked to the UK, Scottish, and Welsh governments to significantly increase their delivery of publicly funded housing by local authorities or housing associations to “supplement the absolute number of houses provided by private sector housebuilders, whilst incentivising housebuilders of these types of homes to deliver homes at a faster rate than under the speculative model”.

Governments “could consider” also a more active role for the public sector in the purchase and assembly of land for development. This the Study suggested could be achieved by granting LPAs additional powers to purchase land and/or to generate revenue to support development or through Community Land Auctions.

It further noted that the Letwin review recommended the establishment of more local development corporations with strong compulsory purchase powers and the ability to raise finance to fund local infrastructure.

In that light, the Levelling Up and Regeneration Act (LURA) since its enactment in October 2023 provides for LPAs to apply for a direction from the Secretary of State to permit Compulsory Purchase Orders to be used for specific projects in the ‘public interest’, such as education, healthcare, or affordable housing, without compensating the landowner for the potential uplift in the value of the land associated with the land being granted planning permission (hope value).

Alternatively, the Study went on, across GB, expectations of higher build-out rates could be reflected in national planning policy and in local plans. LPAs could set the build-out rate it expects housebuilders to achieve and be provided with greater enforcement powers where housebuilders undershoot the required build-out rate.

In addition, the UK, Scottish, and Welsh governments may “wish to consider” measures to increase housing demand, but should then have regard to the following principles:

  • stimulating demand without addressing the shortage in supply may cause house prices to rise. Therefore, implementing measures that increase supply would also be needed need to mitigate the risk that the gains from demand-side interventions accrue primarily to housebuilders and other sellers rather than buyers;
  • measures that seek to stimulate demand among certain groups of customers reduce the incentives on housebuilders to reduce their prices to attract those customers, or to attract other customers. Any intervention should therefore be carefully designed to “target those potential purchasers who would not otherwise be able to purchase a home”;
  • schemes that reduce the deposit requirement buyers face will also reduce the equity those buyers have in their home at the time of purchase, leaving “such buyers vulnerable to future mortgage and house price movements, with negative equity more likely”.
  • any demand-focused scheme will inevitably be temporary, risking unintended consequences, “including creating winners and losers among different groups of house purchasers over time: an important temporal aspect to consider when designing such a scheme”.

 3     Review and assessment

 The Study provides a comprehensive, evidenced, and useful policy commentary (well worth careful reading for its informational and review value), rather than – as might be expected given the CMA’s formal remit to promote competition and to protect consumers – a focused technical dissection of the housebuilding market from an economic, consumer welfare and competition perspective.

Consequently, sometimes it reads more as a policy critique and reform commentary than a market analysis, written by a specialist campaigning organisation or a think tank, reprising key elements of the government’s 2019 Housing and 2020 Planning White papers, and other recent government reviews, notably the Letwin Review.

Accordingly, the Study has already been criticised by some as straying outside its territory by “not minding its own business”, indulging in wishful aspirational group-thinking distracted by well-meaning and often frequently put well-rehearsed generalisations covering the firs area of concern it identified – producing more homes overall, particularly in the areas of highest demand – that risk gathering dust within the corridors of Whitehall rather than acting quickly and directly on the policy dial.

Indeed, a danger is discernible that policy focus is thereby diverted away from its key recommendations it made to government concerning improving consumer protection and information arrangements and the private management of estates (covering the second and third of the areas where the Study identified that government intervention was required to deliver better outcomes), potentially distracting attention away from evidenced reforms and action that the CMA could and should effectively progress itself with central government, squarely within its statutory remit.

Although invariably the Study’s analysis and conclusions made from an objective technocratic standpoint are perfectly sensible and correct, it (perhaps necessarily, and certainly understandably) neglected the political force and dimension of the reasons (largely political economy based) giving rise to the problems that it identified and their constraining effect on effective remedial public action.

For example: national housing targets should be set “in an objective way that better reflects need in a more certain and consistent manner to avoid the counterproductive confusion and uncertainty of recent years, underpinned by a methodology that is easy to understand that uses reliable and up-to-date information, and is assessed at regular intervals to ensure it remains reflective of need with the government provided limited discretion to adjust the original calculation”.

As the last section recorded, the Study went on to suggest using demographic projections as a default regular mechanism to update need assessments. These, however, can fluctuate depending on the assumptions applied, resulting in large swings in local figures that require dampening or, in other words, the exercise of central government ‘discretion’; moreover, it is far from clear that such ‘a predict and provide’ indicator subject to uncertainty is the best one to use.

It probably would have been more helpful to systematically tabulate the different possible ways that local housing targets could be constructed, their pros and cons and other salient considerations, rather than just plump for one option in an ill-considered way.

The overall objective to make local target setting more consistent and certain makes perfect sense but is one hostage to politically disruptive events, inevitable in a competitive political democracy subject to the political economy characteristics of the UK, and of England especially.

One such disruptive event was the 2021 Chesham by-election when the Conservatives lost to the Liberal Democrats in a campaign coloured by concerns of additional housing adversely impacting on the local environment and the quality of life of a generally well-heeled population. It practically acted as a death sentence on the 2020 Planning White Paper.

Likewise, the December 2022 NPPF consultation and the subsequent December 2023 changes cannot be divorced from government political electoral concerns that similar affluent seats across the ‘Blue wall’ of the London environs – including the Surrey Heath seat of Micheal Gove, the current Secretary of state – could be lost at least in part due to similar concern.

Key political economy characteristics other than Nimbyism and the associated tension between local democratic preference and the levels of central compulsion needed to secure nationally set objectives, include the real fiscal crisis of the state, lack of institutional capacity at both central and local levels, as well as the time divergence between the short-term concentrated cost and political pain of planning and other housing reform measures versus their long-term diffused benefits. A tension that can undermine and discourage the levels of sustained political focus needed for desired change to be effectively and substantively actuated.

A more fundamental criticism of the Study was its choice to focus on the extent that housing need is being met as the key metric of effective supply delivery. This comes across as mixed up, big time given that its purported focus was the housebuilding market.

In short, there is no reason why speculative housing market should deliver supply sufficient to meet normatively defined levels of housing need rather than effective demand. Many in housing need will be unable to afford or access the speculative market; and put simply, private housebuilders cannot be expected to act as housing charities.

That is not to say that it would be more economically and socially optimal for private housebuilders to migrate down the value chain and make a more diverse tenure and type offer, consistent with Options 2.8 and 2.10 that the Study advanced (see previous section).

It should have logically gone further and concluded that unless the share of such housing approached 50%, neither the 300,000 nor an alternative target based on housing need will be met.  But, as noted earlier, the Study concluded instead that while this might bring forward additional housing supply, overall, it would not increase numbers in total as these are constrained by the planning system and its ability and capacity to generate sufficient additional planning permissions. That, however, does not necessarily follow.

Indeed, at a practical policy level, the achievement of a sustainable stable and less volatile annual new supply level of 300,000 dwellings in England presupposes a much-enlarged state-enabled housing sector providing or enabling at least 100,000 dwellings a year, whether of social rented or intermediate sub-tenure: 50,000 more or broadly double than the average level of affordable gross supply achieved over the last decade, (see, Annex Table Four ) 

The Study itself reported that, since the Second World War, private developer output has fluctuated between roughly 150,000 and 200,000 dwellings per annum, implying that between 100,000 and 150,000 of a 300,000 total target will need to be met from other sources.

Not only would increasing the share of affordable housing (or requiring it to be built earlier) increase the supply of affordable housing sooner but such an intervention could encourage LPAs to approve applications in the first place.

Also, if the 300,000 target is to be attained, schemes of 2,000 homes of which 1,000 are affordable need to be approved rather than 1,500 homes of which 500 are affordable.

A connected conceptual problem with the Study was that its twofold diagnosis of deficient housing supply and affordability – the nature and operation of the planning system and the limited amount of housing being built outside the speculative approach (such as affordable housing, self-build, and build-to-rent), alongside with too low private speculative build-out rates– was sometimes likewise confused.

Subsequent media attention has largely focused on the emphasis the Study gave to the negative impact of the planning system on market outcomes and the resulting need for the system(s) to be made more predictable and less difficult and costly to navigate, and on occasions the Study seemed to assume that  the planning system provided the overarching problem and that its reform would provide the needed remedy to systemic housing under supply.

Yet it also emphasised that the private speculative housing market due to its particular and developed characteristics and its sensitivity to wider macro-economic conditions meant that model was intrinsically incapable of meeting societal objectives.

In the view of this website, it would have been more intellectually honest and potentially more impact effective (as well as more in accord with its remit) for the Study to highlight that an incremental and partial shift to a contracting rather than speculative provision model was a necessity  if policymakers declared objectives are to be attained, referencing that conclusion to robust and evidenced demonstration of housing market multiple failure.

Such a shift should increase the market absorption rate as well as both total and affordable housing supply. Known public purchases of affordable housing should involve a far lower profit rate than is currently levied and expected on speculative housing as housebuilders would no longer be subject to demand risk, although they would still be subject to some economic risk concerning construction and other costs.

But the levels of expanded public supply consistent with the attainment of the 300,000 target will require additional public funding, bringing it into conflict with the real fiscal crisis of the state: the unwillingness of governments to raise or commit to levels of needed social expenditure due to unwillingness to tax or borrow the necessary sums.

That crisis is not simply a reflection of real economic or financial constraints but also one of underlying denial that UK governments can both achieve desired social objectives based on citizen expectations of service delivery and quality as well as pursue the goal of low taxation.

But the Study, when recognising that the supply share taken by government-supported affordable housing must increase if supply targets are to be met, qualified that conclusion by recognising the policy and resource trade-offs involved, including increased public grant support versus wider macro-economic and public finance imperatives and increased developer contributions versus scheme viability considerations. In other words, it soon reverted to bureaucratic caution, pulling its punches.

So, on one hand, the Study went on ‘right-on’, boldly arguing on the primacy of housing need – as one would expect Shelter and Crisis to do – while, on the other, it then shied away from following the hard policy implications of that chosen approach.

The need for increased affordable housing and social rent has been previously advanced not infrequently by parliamentary Select Committee findings (often populated by MPs in favour of lower taxes and fiscal prudence), that then attract an invariably anodyne governmental response.

Certainly, the issue that must be understood and tackled is, why successive governments of whatever political colour, despite widespread cross party and public support for more affordable housing, have failed or felt unable or unwilling to act in the manner recommended by endless parliamentary committees, successive commissions of the ‘great and good’, as well as much of the mainstream media.

It would have more useful and pertinent for the Study to have queried the seriousness of intent of the UK government’s supply target; in short, is it simply aspirational or, put more cynically, an example of “wishful verbiage” (as a recent commentator put it in a wider political context) rather than a public policy objective backed by real political, financial, and institutional commitment.

If the former, the Study will be one of many that in the past and no doubt in the future that has or will say much the same things, without any or little policy impact, as this website’s earlier submission to the Study, tracked.

Of course, the CMA cannot directly intrude into the sphere of macro-economic and public finance management, but simply recognising such fundamental trade-offs hardly takes matters further.

Rather it behaved more like a pressure group facing both ways. By taking assessed housing need as the correct determinant of target setting – even though, as described earlier, that most studies indicate that would require substantial upward revision of national and local targets (above the national 300,000 level).

Such upward revision, however, would involve further methodological and process change – the same that the Study cautions against on planning certainty grounds and, in any case, would prove an exercise in futility insofar there is no prospect of a higher target being anything other than aspirational in the current and foreseeable policy environment.

The Study also at the same time seemingly ‘swallowed’ developer takes on profitability, viability, and the relationship of the second hand to the new home market.

While the much larger second-hand market (c90% of purchases) may put a partial lid on new build prices in particular locations and contexts, the new build and the second-hand market are not one and the same (perfect substitutes).

Many the housebuilders migrate up the value and price chain and as the Study itself highlighted the new build market has been underpinned by government interventions, most notably in the past by the HtB; nor should the impact of the information imbalances between housebuilder and new build purchasers be under-estimated.

Indeed, the Study itself noted the existence of a new home premium (perhaps 5% in some locations). Its figure 9.1 (supporting evidence document) suggests that during the upward part of the house cycle that premium increases.

The circularity of the argument that reducing housebuilder profits will or may reduce development viability should also be understood.  This is true only to the extent that c20% profit levels are treated as a fixed parameter – predicated on an assumption that they are a necessity – reflecting the characteristics and failures of the market as currently configured.

A six or seven per cent profit level rather than one in the 15% to 25% range represents a difference in price of between £30,000 and £50,000 per home for a home valued at c£300,000, making a big difference at the margin on affordability levels.

Many housebuilders have emphasised that policy certainty and clarity was more important than, for instance, the existence or the level of housing contributions, which they could then factor into their business plans and plan and respond accordingly.

The Study itself also identified evidence that developer contributions could be increased especially on greenfield sites, suggesting that a more consistent and certain approach could induce such an increase.

The fly in the ointment that remains is the associated need to underpin such a partial shift to a contracting model with increased public grant and policy support within the real fiscal crisis of the state, perhaps explaining why the CMA felt that a focus on the planning system was more expedient and more immediately policy relevant, notwithstanding the case made above that is was not intellectually robust  and consistent – cognisant of the prospect that planning reform has been declared as representing an early priority of a new Starmer-led government. That choice is revealing, perhaps, of prevailing civil service attitudes during what is likely to be a political transition year.

4             What should the next government do?

The political and policy challenge is to select and progress the line of least resistance to effectively reform Britain’s flawed institutional housing model, done in such a way that puts both total and affordable supply onto an upward trajectory to a sustainably higher and less volatile level more aligned to national economic and social needs.

The working assumption made here is that a new Starmer-led government, elected sometime in the autumn/winter of 2024-25, facing an immediate economic and political imperative to boost growth sooner rather than later to safeguard and release resources for necessary and vital public service provision and reform without increasing headline direct tax rates, will prioritise planning reform.

This in line with Starmer’s stated commitment that the government will “build rather than block” to support the provision of 1.5 million homes – equivalent to 300,000 homes per year – during the lifetime of the next parliament.

Indeed, it appears that Labour hopes that planning reform by generating a recovery and increase in housebuilding will kickstart the new government’s attempts to achieve higher growth, sidestepping the constraints on additional public investment that the debt reduction component of the fiscal rule framework (public debt as proportion of gdp will fall within five years) will impose.

Rachel Reeves, in her March 2024 Mais Lecture, confirmed the set fiscal rules as central to achieving macro-economic security and stability – the essential states of sustainable steady production-rather than debt-fuelled growth, in her economic worldview.

An alternative view and context is set out in his MainlyMacro blog (Tuesday 26th March)  by an economist who has been instrumental to fiscal rule development, pointing out further that capacity material and labour constraints – likely to especially acute within the housebuilding industry (something that the CMA study omitted) –  actually requires private consumption to be dampened by across the board tax increases.

The inevitable and potentially prolonged time lag (before any planning reform translates into building activity, and certainly into completed homes) translates into growth and productivity outcomes, presents an immediate problem.

That underscores the need for the new government to act quickly, decisively and with laser-like focus, notwithstanding the incessant competing pressures and priorities that it will inevitably face.

If it doesn’t, any prospect of Labour achieving its housing target will be hobbled at the start. On the 300,000 target itself, it is fair to say that it is a figure that has little or no evidential basis, whose virtue seems to be that it is a convenient round number, higher than current supply performance, which has been achieved in the past.

The location, type, and affordability of dwellings provided (composition) are as least, if not more important, than the bald total. The reason, of course that governments, or oppositions expecting to be the next government, do not disaggregate the supply target down into an affordable component is because their insufficient public housing investment would be exposed.

That said, the set target is understandable and visible and, if assumptions are strained to breaking point, potentially achievable – at least temporarily or fleetingly during the peak of the housing cycle.

Yet its current definition is unrealistic. Insofar that it unlikely that net new supply during 2024-25 and then 2025-26, will exceed 250,000 dwellings, a shortfall against that target will start to clock up from the outset. That new supply completions by 2029-30 will be closer to 400,000 than 300,000 (reflecting start levels of that magnitude during 2026-28), sufficient to offset early under performance, is simply not credible.

The lack of effective critical scrutiny is depressing. Even more so, it suggests, that Labour’s commitment to build 1.5m homes is for political show rather than made in serious intent.

Certainly, whether that is an unfair and unfounded accusation will become apparent soon enough. Unless its target is supported both by a committed strategy, detailed policies, and annual plans (very much a ‘Mission’ approach, echoing the committed efforts of early post war governments to achieve 300,000 new homes annually), it can be safely assumed that Labour’s target, as was the Conservatives, will remain an aspirational sop to ‘polite society’ rather than a ‘blood and guts’ political programme.

That Mission should be all encompassing, covering not only New Town and Urban Extension policy and planning, LPA empowerment, the declassification of ‘grey’ green belt land, and affordable housing, but also flats above shops/pubs, transport node densification, and community housing.

The shadow housing spokesperson has promised the imposition of “mandatory targets that bite on individual local planning authorities”.  Settling on what objective sustainable basis they are to be set at a local level itself will take time, given consultation requirements, as would other associated changes consistent with it, such as the conditions when Green Belt land can be used for housing, some of which, such as co-operation with other LPAs, may require primary legislative amendment to LURA rather than NPPF revision (the author of this post is not a planning expert and expects the Shadow Levelling Up and Housing teams to be fully engaged now in working through these issues ready for alternative government detailed engagement with the civil service) .

Rather than getting hang up on what demographic projections should be used, simpler metrics such as local affordability and past delivery (perhaps measured by delivery of additional housing per 1000 dwellings could be used, if possible.

But Gove’s December 2022 changes (Gove changes) should be rescinded with best possible alacrity and replaced with emergency guidance that LPAs in future will be expected to deliver locally housing volumes that summed across the country are consistent with the achievement of the national 300,000 target with some additional buffer provided, covering the points below and others.

LPA’s that have paused Plans or rescinded planning approvals in the wake of Gove changes, should be individually instructed to resume Plan-making in line with that target, as should LPAs without an up-to-date Plan, and given a deadline to do so, monitored by the DLUHC, or whatever its successor may be called. Rescinded approvals should be revisited in line with the new guidance again within a deadline, which if missed will mean that determination by the Independent Planning Inspectorate.

Securing change working with such ‘reluctant soldier’ LPAs will not be easy. However, it is best to take any political pain in the early period of government, necessary in any case because of the timelag issue, as identified above.  Any ‘Chesham’ effect will be better withstood earlier than later in the government’s lifetime.

The CMA Study, indeed, provides civil service and administrative cover and support for such actions and thus now provides a timely and useful resource.

LPAs should be given every possible encouragement and incentive to deliver additional housing sooner rather than later whether through mechanisms, such as the New Homes Bonus, infrastructural and other financial support, the expeditious approval and support of New Town Local, and other Development Corporations where appropriate, and though linkage to measures more specifically designed to increase affordable housing, such as lifting local borrowing caps and the use of CPOs,  as well as the reinstatement of 100% receipt recycling, especially across areas where additional housing is both most needed and most likely contribute to productivity enhancement.

Then, of course, the overarching real fiscal crisis of the state overarching constraint could bite. Yet, public infrastructural investment in transport and sometimes other supporting social infrastructure, will invariably be required to pump prime private housing development investment in relation to large scale schemes.

These include the Oxford-Cambridge corridor, New Towns and urban extensions, and transformative brownfield urban developments, such as along the Thames estuary.

The same point applies to the necessary shift away from the private speculative towards a more towards a more public contracting partnership model, where upwards to 50% of the annual 300,000 additional housing target is affordable, custom-or built to rent.

Without such a shift, the 300,000 target, cannot and will not be met. It will require, however, some additional public funding support and guarantees that, in turn, will need to be an integral part of the 2025 Comprehensive Spending Review process.

It must be understood that if funds are not apportioned to public infrastructure and housing investment, neither the new government’s overarching economic nor its housing objectives will be met. As such it will provide an early test of the pragmatism – both in wider economic as well as political terms) of the application of Labour’s fiscal rules, as well as of its housing policy.

In planning policy terms, early planning guidance could provide a nudge in that direction by indicating an expectation that 50% of additional new supply should be locally affordable, whether officially defined as such or targeted to home buyers at lower quartile prices. Early delivery of affordable housing within large schemes along the lines that Letwin advocated should be put in train.

Creating a fast-tracked route for in-principal approval for applications that are in line with an adopted local plan, providing housebuilders with greater certainty to begin development, could also enter the policy menu.

Appendix A

Preventing the proliferation of private management arrangements on new housing estates

Recommendation 1.1: Common adoptable standards

The UK, Scottish, and Welsh governments each implement common adoptable standards for public amenities on new housing estates.

Recommendation 1.2: Mandatory adoption

The UK, Scottish, and Welsh governments each implement mandatory adoption of public amenities on new housing estates (outside of minor, well-defined exceptions).

Providing greater protection to households living under private management arrangements Recommendation 1.3: Enhanced consumer protection measures

We recommend that the UK government, in consultation with the Scottish and Welsh Governments, introduce enhanced consumer protection measures, underpinned by a robust enforcement regime, for households living under private management arrangements. Recommendation 1.4: Prohibition of new embedded management arrangements

The UK, Scottish, and Welsh governments each prohibit the establishment of new embedded management arrangements.

Recommendation 1.5: Guidance for residents’ management companies

We recommend that the UK, Scottish, and Welsh governments each provide guidance to members and directors of residents’ management companies to support and enable them in effectively managing the amenities on their housing estates.

Quality of new homes produced and service provided by housebuilders A single mandatory consumer code and the New Homes Ombudsman Scheme

Recommendation 2.1: A single mandatory consumer code

The UK government, in consultation with the Scottish and Welsh Governments, develops and approves a single mandatory consumer code for all housebuilders operating in GB. Recommendation 2.2: New Homes Ombudsman Scheme

The UK government, in consultation with the Scottish and Welsh Governments, activates the New Homes Ombudsman Scheme.

Eliminating drip pricing and providing greater clarity to buyers regarding the true cost of their new home

Recommendation 2.3: Prohibition of drip pricing

The UK government, in consultation with the Scottish and Welsh Governments, establishes a specific banned practice on the drip pricing of all mandatory elements of a new home, as well as other charges that are presented as ‘optional’ but which it is reasonably foreseeable that most consumers would have to pay, even if others could avoid them.

Recommendation 2.4: Disclosure of optional extras

The UK government, in consultation with the Scottish and Welsh Governments, requires that where housebuilders present consumers with genuinely optional extras as a part of the purchasing process, these optional extras and their prices are prominently and fully disclosed alongside the headline price.

Developing an independent single consumer satisfaction survey and publishing key quality metrics

Recommendation 2.5: Single consumer satisfaction survey

The UK government, in consultation with the Scottish and Welsh Governments, requires an independent body to develop, maintain and undertake a single consumer satisfaction survey on the quality of new homes and the service provided by all housebuilders.

Recommendation 2.6: Publishing key quality metrics

The UK government, in consultation with the Scottish and Welsh Governments, requires housebuilders to participate in the survey, display their key quality metrics to consumers, and share this information with an independent body for public dissemination.

Appendix B

Reforming the planning process

Option 2.1: More objective and effective use of targets to ensure housing need is met.

Governments are best placed determine an appropriate methodology to set a national housing target. In determining an appropriate methodology, the governments will need to consider: (a) how LAs could effectively align their local plan with the national target; and (b) whether and, if so, how the target should reflect the need to address existing levels of supply, as well as meeting future housing need.

Option 2.2: Effective monitoring and enforcement of local plans to encourage housebuilders to bring forward successful planning applications and build new houses.

  • LPAs should be incentivised to have an up-to-date local plan in place. Incentives could include: ringfencing funds that LPAs can use only if they have an up-to-date local plan in place;
  • making it more difficult for LPAs to reject planning applications if they do not have a local plan in place or if they do not have an up-to-date plan in place;
  • central governments taking over the decision-making authority in a local area until a local plan is in place and as a last resort, imposing a local plan on the LPA, noting that “this would go further than the government’s recently announced plans to drive an improvement in local plan production”.

Option 2.3: Streamlining the planning system to significantly increase the ability of housebuilders to begin work on new projects sooner and bring forward marginal projects which may have previously been non-viable due to the costs of taking them forward.

The UK, Scottish, and Welsh governments could consider the following options for streamlining the planning systems:

  • increasing the emphasis on local plans as the key means by which communities and their elected local officials decide the amount, mix, design, location, and overall standards of new housing in their area, rather than by reviewing planning applications on a case-by-case basis;
  • creating a fast-tracked route for in-principle approval for applications that are in line with an adopted local plan, so housebuilders have greater certainty to begin development;
  • formally reviewing the varied LPA schemes of delegation with a view to harmonising the complex set of rules and removing the use of Planning Committees for those applications which are broadly in-line with the local plan and/or which below an agreed threshold;
  • improving the appeals process, as informal hearing and written representations appeals can cause delays and have an adverse impact on the delivery of smaller housing schemes and on SME housebuilders.

 Improving the planning processes

Option 2.4: Clearly defining and rationalising statutory consultees to reduce the delay caused by the statutory consultation process.

 Option 2.5: Effective monitoring and enforcement of deadlines for statutory consultees so as not to unnecessarily delay the planning process.

Measures to support reforms to the planning systems and processes

Option 2.6: Improving LPA capacity and resource by raising planning fees to a cost reflective level and ringfencing those fees.

Option 2.7: Additional support for SME housebuilders through better guidance, standardised LPA policy and a simpler ‘outline’ stage of planning permission.

Measures to support a higher build-out rate

Option 2.8: LPAs could require greater diversity of housing tenure for larger sites to be granted planning permission.

LPAs could require increased diversity of tenure for larger sites to be granted planning permission by increasing the proportion of affordable, build to rent or custom build homes on sites allow for more homes to be absorbed within different sub-segments of the local market(s) without housebuilders needing to reduce the prices of the housing they produce for the private market, thereby improving the speed of housing delivery.

They could publish their policy on housing tenure requirements, meaning they are known by housebuilders and reflected in land transactions to be decided and operated in a similar way to LPA polices on affordable housing and developer contributions, noting that the Letwin  Final Report recommended a similar measure for developments providing over 1,500 dwellings, although it has not been taken forward by the UK government.

Option 2.9: LPAs could be incentivised by governments to increase the number of homes that are delivered through smaller sites.

The UK government’s NPPF requirement that LPAs should identify land for at least 10% of their housing requirement on sites no larger than one hectare could be strengthened to require explicit identification of the sites that will comprise this 10%, alongside regular enforcement of the policy. A similar policy could also be considered by the Scottish and Welsh Governments, to support SME housebuilders and increase housing delivery rates.

Option 2.10: LPAs could require housebuilders to increase the diversity of the types of homes they build on larger sites.

LPAs could require housebuilders to increase the diversity of the types of homes (type, size and style, design, rather than tenure?) that they build on larger sites. Sites with greater diversity of types may build out more quickly as the varying types of homes entering the market are more likely to appeal to different sub-segments of the market and therefore such sites are less constrained by the local absorption rate.

Share this:

  • Click to share on X (Opens in new window) X
  • Click to share on Facebook (Opens in new window) Facebook
  • Click to print (Opens in new window) Print
  • Click to email a link to a friend (Opens in new window) Email
  • Click to share on WhatsApp (Opens in new window) WhatsApp
  • Click to share on LinkedIn (Opens in new window) LinkedIn

Filed Under: CMA Study, Housing, Macro-economic policy, Real Fiscal Crisis of the State, Starmer Tagged With: CMA Study, housing, real fiscal crisis of the state

Making Sense of Housing Supply Statistics

28th September 2023 by newtjoh

This post signposts readers to the official sources of housing statistics relating to new supply and dwelling stock for England collated and reported by the Department of Levelling Up, Housing and Communities (DLUHC), with some wider reference to UK-wide statistics that the Office of National Statistics (ONS) reports.

Section 1 provides links to the four main relevant source time series, the housing supply, net additional dwellings (net new supply), and the affordable housing, the dwelling stock, and the indicators of new supply (termed new housebuilding), with relevant data summarised in the commentary and in the seven annex tables.

All data and commentary refer to England unless otherwise stated.

Links are also provided to dashboards recently published by the DLUHC within their respective series and by the House of Commons Library that will allow them to access some data (sometimes incomplete) at an individual local authority level at a touch of a mouse.

The aim is to provide policymakers and other interested users with a user-friendly guide to the availability of such statistics and their most appropriate application and use depending upon the purpose of the enquiry, along with their associated limitations and uncertainties, hopefully reducing reader use of midnight oil and wet towels in the process.

Section 2 concludes by summarising the primary issues and problems connected with the series data, before making recommendations concerning their future presentment to users.

Comments and observations are welcomed to asocialdemocraticfuture@outlook.com. If you would like a pdf please request through this address.

1          The main housing supply statistical series

Housing supply: net additional dwellings (net new supply) series

The net new supply series is presented by the DLUHC as the primary and most comprehensive available new housing supply metric for England. This is for two primary reasons.

First, it includes additions and losses to the stock as well as new build completions, which can be higher or lower than net new supply, taking account of net additions or losses.

For example, between 1961 and 1980, as large-scale post war slum and redevelopment demolitions and clearances proceeded apace, net new supply lagged new build completion totals.

Conversely, across recent decades, as gains to the stock from net conversions and from net changes in use have progressively tended to exceed losses from demolitions, annual net new supply has exceeded new build completion totals.

Second,  as the DLUHC technical notes on the series sets out, its method of compilation is more comprehensive and accurate.

LAs are required to take account of all the changes to the housing stock within their areas over the previous financial year before inputting them into – what is officially termed – a standardised housing flows reconciliation (HFR) form, and to submit that no later than the subsequent September. The Greater London Authority (GLA) collates similar information from the London boroughs.

Each LA, therefore, has up to five months from the end of the financial year to submit their annual HFR return, compared to the much shorter six-week submission period connected with the building control based quarterly new housebuilding series, considered later.

By having more time to reconcile diverse potential sources of completed new build activity, including from council tax, building control and other records, as well as site visits, LAs can consequently compile a more complete and comprehensive count of additions to their local stocks.

Each November successive to the preceding financial year, the DLUHC publishes a release and a set of accompanying live tables that together describe changes to England’s net supply position.

For example, the 2021 to 2022 annual statistical release published in November 2022 reported the net change that took place between 1 April 2021 to 31 March 2022.

Live Table 118 reports total annual net additions for England, by region, since 2000-1.

Table 120,  since 2006-2007, has broken down the different components of net supply to include:

  • new build completions;
  • net changes to the dwelling stock resulting from gains or losses, whether attributable to approved changes of planning use, to conversions, or from demolitions; and,
  • from 2015-16 onwards, changes in use resulting from permitted development rights (PER’s).

Table 1 below provides a summary of the data provided in Table 120.

It confirms that net supply exceeded new build completions by c20,000 dwellings per annum between April 2006 and end March 2022.

More significantly, it shows the proneness of net new supply to fluctuate in a lagged response to the wider macro-economic and housing market conditions, with 2012-13 net supply (reflecting collapse of private speculative activity during and in the wake of the 2008-10 global financial recession), barely half of the level subsequently achieved during 2018-20.

It can be expected that annual net new supply could dip below 230,000 dwellings during the next few years in response to recent housing market uncertainty induced by rising post-covid inflation and interest rates.

Certainly, there is no immediate prospect of the 300,000-dwelling target – as the data shows is clearly aspirational and rhetorical rather than policy-led in nature – being even remotely approached.

Table 1: Net new supply summary, April 2006 to end March 2022

Year (Apr-Mar) DLUHC Table 120: New build completionsDLUHC Table 120: Non-new build total net additions  DLUHC Table 120: Total new net additions (new supply) Non-new build net additions as % of total new supply Total new supply as % of peak (2019-20=100)
2006-07193,08021,860214,94010.288.6
2007-08200,30023,230223,53010.492.1
2008-09157,63025,140182,77013.875.3
2009-10124,20020,670144,87014.359.7
2010-11117,70019,690137,39014.356.6
2011-12128,1606,740134,9005.055.6
2012-13118,5406,180124,7205.051.4
2013-14130,3406,270136,6104.656.3
2014-15155,08015,610170,6909.170.3
2015-16163,94025,710189,65013.678.1
2016-17183,57033,780217,35015.589.6
2017-18195,39026,890222,28012.191.6
2018-19214,41027,470241,88011.499.7
2019-20219,12023,580242,7009.7100.0
2020-21191,82020,050211,8709.587.3
2021-22210,07022,750232,8209.895.9
Average 2006-22168,95920,351189,31110.578.0
Average 2017-22199,96223,515223,47710.592.1

Tables 122 and 123 reports total net additional supply by LA district and their component flows, respectively, since 2001-2.

The House of Commons library has produced a very useful online housing supply dashboard in which users at a touch of their mouse can access and print net new supply data covering the most recent ten year reported for individual LAs, as is required.

Alternatively, the DLUHC’s own interactive dashboard can be consulted, although it is less print-friendly.

It does, however, offer a limited facility to access reported net new supply at a local LA level per 1,000 dwellings basis over a range of years.

Whilst the incompleteness of data coverage reported at that local level should be borne in mind, the range of performance displayed between even neighbouring authorities, suggests an under-researched area.

Table 124 reports annual changes in the flows of communal non-self-contained accommodation by LA district. These changes are separate to and are not included in the other tables or headline net supply figures.

Column C of Annex Table One, also since April 2006, charts significant variation between the between the total new build completions reported by the net new supply series and the DLUHC quarterly new housebuilding series.

That series undercounts new build completions by an average annual c17%, increasing to c24% during the recent 2017-22 period.

That tendency underscores the need to use this net new supply series measure not only new net supply, but new housebuilding completions since April 2006.

The 2012-21 dwelling estimates – calibrated to the 2021 census, as the next sub-section explains – suggest that the net new supply series has even itself under recorded net new supply over the past ten years.

The net new supply statistics are also compared against the latest census on its release every ten years to ensure that the sum of net additions over that period are calibrated to the latest census total dwelling count.

Any difference between the that and previous census total dwelling figure is spread evenly across the previous decade consistent with the adjustments made to the dwelling stock estimates.

Such an adjustment to the 2012-21 net supply series will be reported in the November 2023 net new additions (supply) release.

The 2021 census dwelling count will then provide the baseline for future reported annual net supply series changes that, in turn, will provide the data source for successive reported total dwelling stock estimates in England, until the next 2031 census adjustment takes place.

Other revisions to the series live tables are generally limited to those provided by LAs relating to the previous two financial years.

In summary, the net supply series identifies and measures the different components of net new supply, including new build completions, since April 2006.

It provides consequently the primary and most comprehensive and accurate available statistical record of the different components of new supply at both national and LA levels.

The series, however, is only published annually in November for the preceding financial year; given that and because it does not cover starts, it is not forward-looking.

Accordingly, to obtain a more timely but imperfect indicator of new build completions for the year preceding November publication of this series and of future activity, the demonstratable inaccurate new housebuilding series must be consulted.

The department also in 2011-12 removed the information reporting requirement on LAs to categorise new supply by tenure and the net supply series does not break down the reported net supply total by tenure.

This is significant insofar that gross reported new affordable supply greatly exceeds net new affordable supply – as the affordable housing series sub-section will show and discuss.

The dwelling stock series

The dwelling stock series reports total stock estimates back to 1801, when the first census took place, and from 1961 onwards its tenure breakdown.

Until April 2000, the annual dwelling stock estimates provided the source of the annual net additions figure. Starting with 2000-01, the annual dwelling stock estimate has been equal to the previous year’s dwelling stock estimate plus or minus the latest annual net supply of housing figure, subject to the census adjustment process outlined below.

Both the dwelling and net supply series are subject to a decadal retrospective and new baseline census adjustment, usually applied in the year following each successive census.

The May 2023 statistical release for the year ending 31 March 2022 calibrated dwelling stock figures for 2012 to 2021 to the Census 2021 dwelling count figure.

This involved an annual c6,000 dwelling upward adjustment to the previous annual dwelling estimates (the annual net supply change reported in that series from 2012 onwards).

These previous annual net supply figures, as the previous sub-section noted, likewise should be adjusted in the November 2023 net new supply release and its associated tables.

The dwelling count estimates reported for year ending end March 2022 are provisional and subject to revision.

The statistical release and the live tables break down the total dwelling estimate into owner-occupied, private rented sector, local authority housing and housing association tenures, save that it is not possible to split the private housing stock into owner-occupied and private rented sector at the local authority district level.

The tenure split is based on periodic survey data mainly for the owner occupied and privately rented sector, including the English Housing Survey, Labour Force Survey, and on local authority and regulator of social housing returns.

The technical notes accompanying the series provides more background and information.

They confirm that a dwelling in this series is defined in line with the census definition, which defines a dwelling as a self-contained unit of accommodation where all the rooms (including kitchen, bathroom, and toilet) in a household’s accommodation are behind a single door, which only that household can use.

A dwelling can therefore consist of one self-contained household space or two or more non-self-contained household spaces at the same address.

Ancillary dwellings (for example, ‘granny annexes’) are included provided they are self-contained, pay separate council tax from the main residence, do not share access with the main residence (for example, a shared hallway) and that there are no conditional restrictions on occupancy.

Communal establishments, that is establishments providing managed residential accommodation, are not counted in overall housing supply. These include university and college student, hospital staff accommodation, hostels/homes, hotels/holiday complexes, defence establishments (not married quarters) and prisons.

But purpose-built (separate) homes (for example, self-contained flats clustered into units with four to six bedrooms for students) are included in the dwelling estimates, with each such self-contained unit counted as a dwelling.

Non-permanent (or ‘temporary’) dwellings are included if they are the occupant’s main residence and council tax is payable on them as a main residence. These include caravans, mobile homes, converted railway carriages and houseboats.

Permanent Gypsy and Traveller pitches should also be counted as dwellings, if they are, or likely to become, the occupants’ main residence.

Shared ownership dwellings are currently counted as owner occupied within the dwelling stock series.

Dwellings classified as Other Public include dwellings owned by government departments, such as Ministries of Justice and of Defence. They can be vacant awaiting sale or redevelopment.

Table 2 below provides summary data for the decadal years 2001, 2011, 2021, and for 2022.

Table 2: Total dwelling stock estimates and percentage share by tenure, England.

Year Ending 31 MarchOwner-Occupied (1,000s)Private Rented Sector (1,000s)Social and affordable rented (1,000s)Other Public (1,000s)TOTAL
200114,7352,1334,236103           21,207
201114,8284,1053,98162           22,976
202115,9144,8754,10533           24,927
202216,1244,8854,11734           25,160
 % of total stock
200169.5%10.1%20%0.5%100%
201164.5%17.9%17.3%0.3%100%
202163.8%19.6%16.5%0.1%100%
202264.1%19.4%16.4%0.1%100%
Source:Tables 2 and 4, DLUHC Dwelling stock estimates 2022 in release

DLUHC live Table 100 reports from April 2009 onwards, the total dwelling estimates and its tenure breakdown to down district local authority (LA), save that owner occupied and private rented sectors are subsumed into one private sector category at that LA level.

Table 104 provides a historical annual dwelling stock series, dating back to 1801, with a tenure breakdown first provided in the census year 1961 and then annually from 1969 onwards.

The short story it tells is that in 1961 the LA and private rented (PR) stock combined exceeded the c6.1m dwelling owner-occupied stock.

By 1980 the LA stock continued to climb to c5.2m, before plummeting to its current level below 1.6m.

The PR stock declined from c4.4m in 1961 to 1.6m in 1986, before recovering to its current level of c4.9m.

The owner-occupied dwelling stock progressively increased in total numbers throughout the period to its current c.16.1m dwellings, notwithstanding that its percentage tenure share fell from its recorded high of c70% in 2001 to c64.5% in 2011 and then flatlined for much of the last decade.

Annex Table Two derived from DLUHC live Table 104 reports the total stock dwelling estimates for each year since April 1991 up to 2022, by tenure.

Annex Table Three reports the annual change in the estimated dwelling stock for the same period relative to the previous year and the total period change, also by tenure. It offers the best available backward-looking guide to longer term interlinked stock and net supply trends calibrated to the decadal census.

The ONS publishes a dwelling stock by tenure, UK series recording the estimated number of dwellings in the UK by tenure for each of the UK’s constituent countries, where available, as well as at an aggregate UK and Great Britain level, formerly produced by DLUHC predecessors.

Dwelling stock data in total and by tenure for each English LA can be obtained by a flick of mouse using the House of Commons Library dwelling stock  interactive dashboard.

Affordable housing series

The affordable housing series reports the gross annual flow of additional dwellings for rent or sale provided for specified eligible households whose needs are not met by the market.

Such housing can be newly built, acquired, or result from a net gain secured through conversion or from a change in use.

The gross totals reported in the series take no account of demolitions or sales of existing affordable dwellings.

Until recently, these greatly exceeded gross gains, resulting in a substantial net annual reduction in the affordable stock, and then for the last decade or so only a small net increase (see Table 4): a bit akin to trying to run up an accelerating downward escalator.

Headline affordable series figures tend therefore to mask that key outcome.

Affordable rented housing as a sub-tenure (termed government affordable rent in this post), was introduced in 2011 by the incoming Coalition government, to be let by providers of social housing to eligible households at a rent of no more than 80% of the local market rent (including service charges, where applicable).

In contrast, social rented housing is let at c50%-60% of local market rents according to nationally set guidelines.

Intermediate affordable housing is homes for sale and rent provided at a user cost above social rent but below market levels, subject to it remaining at an affordable price for future eligible households and/or to the recycling of expended subsidy into the support of alternative affordable housing provision.

It can include shared ownership and tenure forms where some equity is retained by the provider, as well as other low-cost homes provided either for sale and intermediate rent and, from 2021-22, through First Homes, a tenure form that the current government apparently intends to eventually account for at least 25% of all affordable housing units delivered through planning obligations.

Dwellings purchased under the post-2013 Help-to-Buy programmes were not, however, considered or recorded as affordable housing as purchaser access was not made subject to an income qualification.

Affordable starts and completions for the preceding financial year are published in the succeeding late November/early December alongside updated live tables, which are also subject to scheduled revisions of earlier key figures each June.

Table 1000 reports the most up-to-date summary estimates of affordable housing provided in England since 1991-92.

Table 1000C additionally breaks down that summary data to type of scheme, while Table 1000S reports affordable starts but – as across the series – only from 2015-16 onwards.

Tables 1008C and 1008S break down the total affordable completions and start information to region and LA district, while Tables 1006 and 1007 do likewise for defined tenure types.

Table 1009 breaks the total affordable completion data down according to whether the provided dwellings were newly built or acquired, by tenure.

Tables 1011C and 1011S report from 1991-92 affordable total completions provided and starts (from 2015-16), according to type and source of funding (including nil grant S106), broken down to LA district level.

Annex Table Four collates affordable completion data taken from Tables 1009 and 1011C, by sub-tenure, for the entire 1991-92 to 2021-22 period covered by the affordable housing series.

It reports that gross affordable provision for the April 2018-22 period averaged annually c57,000 – the highest level since April 2007-11.

This was considerably above that above the April 1999-2003 low point average of 33,500, but lower than the c68,500 annual average recorded during the April 1992-96 high point period.

However, Table Annex Four also reports that most affordable dwellings provided between 1999-2003 were let at social rents; during that latest 2018-22 period most were rather let at higher government affordable rent or on intermediate tenure terms.

This compositional variance (amongst other potential ones, such as changes in the bedroom composition of the provided dwellings and/or their location) is a salutary example of the imperative to drill down into the detail and institutional/policy context of subject data before jumping to judgement about headline data and to be wary of soundbite political uses of it.  Context is all-important.

Sight should also not be lost that provision trends are a function of previous start levels, which provide a forward but imperfect indicator of future completions; nor that the affordable housing series is particularly prone to cyclical fluctuation related to funding programme changes and their associated delays.

Table 3 simply reports from Table 1011S starts for the April 2018-22 period, by tenure (when known), to provide an indication of future short-term gross completion levels.

New build completions, however, tend to lag for longer than might be expected where a one-to-three-year construction period is assumed. Large scale regeneration projects involving multi-phases invariably straddle many years but could possibly relate to incentives to record starts for programme monitoring purposes or to other unquantified reasons.

Table 3: Affordable starts, by tenure, April to end March, 2018-22  

 Social Rent Government Affordable Rent Intermediate Tenure UnknownTotal Affordable Starts
2018-19          8,143                        25,913                25,667             1,107                      60,830
2019-20        12,108                        24,523                25,642             5,972                      68,245
2020-21        11,968                        19,609                17,155             8,972                      57,704
2021-22        14,877                        13,976                17,672           16,666                      63,191

Note 1:  Social rent includes London Affordable Rent (LAR)

Note 2:  Intermediate Tenure total for 2021-22 includes 119 First Homes starts.

Annex Table Five also uses Table 1011C to estimate the number and proportion of affordable dwellings provided using S106 without the use of public grant – in effect through developer cross subsidy realised from sales of dwellings sold at market values then used to help finance affordable social housing dwellings – secured through the planning system and the associated use of S106 agreements.

This table identifies a general trend since the nineties for the proportion of affordable housing across tenures provided through S106 to progressively increase to become its primary funding mechanism, save for some trend interruption in the wake of the Global Financial Crisis (GFC) and for some recent indications of its stalling, probably related to wider conditions in the housebuilding market associated with input and interest rate costs rising in the wake of covid.

Dwellings reported as being provided through nil grant S106 exceeded 50% of total affordable completions in 2019-20.

More detail on how S106 became the primary funding mechanism of affordable (social) housing is provided in Section 1 of The New Infrastructure Levy (IL): Going Round the Mulberry Bush.

Table 1012 reports affordable housing starts and completions, funded by Homes England, combined with the GLA from April 2012, both for starts and completions, between 2009-10 up to 2022-23, reproduced in Annex Table Five.

Further useful background is provided by the latest June 2023 Homes England Housing Statistics publication, while GLA dedicated data can be assessed here.

The affordable housing series is wider in scope and coverage. It aims to provide a complete picture on affordable housing delivered, irrespective of funding mechanism or its source, using more disparate sources, most notably LA annual housing statistical (LAHS) returns.

It is to be expected, therefore, that the affordable completions and starts (where applicable) reported by the DLUHC affordable housing series in its Tables 1000 to 1011 are higher than the combined Homes England and GLA figures that Table 1012 reports.

c44% of 2021-22 total completions of c60,000 dwellings were provided through nil grant S106 – c27,000 dwellings, as Annex Table Five reports.

Added to the c37,000 dwellings reported that year as funded from Homes England GLA combined programmes produces c63,000 dwellings: c5per cent greater than the Table 1011C total.

LAs are asked to only record affordable housing that has not been reported by Homes England or the GLA including affordable housing that did not receive grant funding or developer contributions under planning agreements.

Some nil grant completions could be included in the Homes England/GLA data. Homes England has confirmed to this website that some nil grant S106s are indeed included in its data returns, and it is possible that some LAs double count by including them also in their LAHS returns.

New DHLUHC Table 1013 breaks down affordable provided completions to type of provider, whether LA, registered and non-registered registered providers (RPs), or unknown.

Historically, only non-profit-making organisations, generally and previously known as housing associations, could be registered as providers of social housing or social housing landlords.

Since April 2010 profit-making organisations have been able to register but their output is not meant to be recorded by the affordable housing series, even though it is possible that some such units are included in LA statistical returns.

Registered private providers of social housing (termed RPs in this post) can include organisations providing supported housing and care, local authority subsidiary companies, community groups seeking to develop new housing, commercial developers setting up small subsidiaries to receive Section 106 affordable housing, subsidiaries of investment companies and funds, entities established by registered provider groups, either new parents for group structures or new subsidiaries, as well as small charities, such as alms houses.

According to Table 1013, RPs provided 47,885 of the total 59,356 estimated or recorded new affordable 2021-22 gross affordable (social housing) new supply.

As was highlighted at the beginning of this sub-section, the main drawback of the affordable housing series is that its affordable provision totals are reported gross and do not take account of dwelling losses resulting from sales, demolitions or from other causes. It thereby does not report actual net affordable supply.

The difference between gross and net new affordable supply – as for gross and net total supply the preceding sub-section noted – can be wide and significant.

Most pertinently, the introduction of the Right-to-Buy in 1980-81 led to the losses in the social housing stock resulting from sales progressively outpacing the gross supply of new supply of affordable housing for rent.

Table 678 shows that since 1981 more than two million social housing dwellings were sold. Although sales of RP owned social housing have taken a growing share in recent years, 94% were to local authority tenants across the entire period.

This propelled a reoccurring and generally widening annual net loss of social rented stock, peaking at c98,000 dwellings in 2002-2003.

A January 2023 release on social housing and demolitions 2021-22 updated on nascent but continuing DLUHC efforts to address the absence of a net affordable supply series.

One key output is a seminal time series tracking sales and demolitions of low-cost rental social housing from 1997-98 against the gross new supply of low-cost rental dwellings provided by LAs and RPs.

Figure One (figure 1.7 of the release) provides a graphical representation of that series.

The release explained or claimed that this exhibited secular trend or pattern change was driven mainly by a sharp decrease in sales since 2003-04, as Table 678 reports; by a general decline in the number of demolitions since 2001-02; and, since 2008, by increased gross affordable homes investment.

It did caution, however, that the incompleteness of the sources of the new time series meant that it cannot be taken “as a comprehensive and fully accurate measure of net new supply”, before introducing a more “experimental” statistical dataset aiming to offer a net flow-based measure estimate of annual changes in the net supply of affordable housing for rent, summarising the in- and out-flows to this sector of the housing stock in England.

38,668 new affordable housing units for rent, according to this flow-based dataset, were delivered during 2021-22, while c19,000 low-cost rental dwellings were sold and c7,500 demolished.

Although the LA rental stock decreased by c7,200, the RP stock increased by c18,900, resulting in an estimated annual net total stock increase of 11,700 affordable homes for rent, according to the release, slightly more than the previous year’s 11,200 figure.

The results summarised in Table 4 below – derived from the dwelling statistics reported in DLUHC Table 104 – are supportive of the release’s tentative conclusions, suggesting that they were, perhaps, couched in an over-cautious manner.

Moreover, Table 3 of DLUHC’s Dwelling stock estimates 2022 in release reports a 12,000 increase in the stock of social and affordable rented sub-tenure stock in 2021-22 and over 13,000 on average annually since April 2009, when the loss of stock in the other public sector category is not considered.

Table 4:  Average annual change in stock during stated periods, 1992-2022, by tenure

31-MarOwner OccupiedRented Privately or with a job or businessRented from Private Registered ProvidersRented from Local AuthoritiesLA+RP+other public sectorAll Dwellings
1992-2009 97 108 84-116 -36  168
2009-2022 89 91 32-19  10 190
1992-2022 93 101 62-75-17 177

The existing official published data therefore indicates that during the 2009-2022 continuing annual net gains meant that the total affordable stock (RP+LA+other public sector) grew between April 2009 and 31 March 2022 by an annual net average of above c10,000 dwellings (see Annex Tables Two and Three for more detail).

That net increase was, however, crucially far lower – because of the continuing impact of sales especially and demolitions – than the headline average annual gross increase of c57,000 new affordable housing dwellings completed or provided, reported in the affordable housing series, (see Annex Table Four), during the same period.

As was noted earlier, a key and under highlighted outcome and metric.

New Housebuilding: new build

The DLUHC changed the title of this release from “House building: new build dwellings’ to “Housing Supply: indicators of new supply” in September 2020.

A confusing change insofar that the live tables associated with it are only concerned with new build. It also risks conflating the series with the “Housing supply: net additional dwellings” series described by the department as the “primary and most comprehensive measure of housing supply” and “a leading indicator of overall housing supply”.

Indeed, it was for that reason that the Housing supply: net additional dwellings” series was the first to be described and discussed by this post.

To avoid such possible confusion, this post terms the series in line with what its live tables really report.

The Office of National Statistics (ONS), which continues to publish new housebuilding data according to country and at a pan Great Britian and UK level in its House building, UK: permanent dwellings started and completed by country statistical series.

ONS tables relating to England replicate the live tables below published by the DLUHC, updated to incorporate revisions, unlike the annual statistical release commentaries.

Table 213 covers both new build starts and completions, by sector tenure, both on an annual financial year (from 1969-70) and on a quarterly non- seasonally adjusted basis, (from quarter, Q1, 1978 to Q1 2023 at the time of writing, but as is updated by the quarterly reporting cycle).

Table 222 provides similar but quarterly seasonally adjusted figures.

Table 244 catalogues the longer-term new housebuilding record, broken down by tenure also when provided, but on a calendar year basis, from 1946 onwards.

It can and should be used to identify and review longer term trends and features concerning new build completions and its tenure split, as to when provided, prior to April 2006 in conjunction, as appropriate, with Table 213.

Tables 217, 253 and 253a report dwellings completed and started by tenure, broken down to region (quarterly) since 1990-91 (217), LA district (253, by financial year, 252a, quarterly since 1980-81).

Table 254 reports completions and starts, according to whether it was a house of flat, by bedroom size, and by tenure.

All these tables, as noted above, breakdown according to tenure, as to when started or completed according to provider, in contrast to their final tenure status when occupied.

That status can diverge for reasons that include that a progressively larger proportion of affordable dwellings since the early 1990s have been built by private developers in accordance with section 106 planning agreements.

Although ownership of many of these dwellings may later transfer to housing associations, they are often reported and recorded as private enterprise completions within new housebuilding tables.

The most serious and fundamental drawback by far, however, of the series live tables is that they under-enumerate recent new build completions, in total and across tenures, often by a large magnitude, as the net new supply sub-section earlier highlighted.

Column C of Annex Table One reported then that the annual discrepancy between new completions reported in Table 213 of this series and net supply Table 120 reached an annual average of 24% across the most recent 2017-22 period.

This discrepancy also appears sensitive to the wider economic and construction cycle, and/or other determining factors: new build completions reported for 2014-15 in net new supply Table 120 were 25% higher than such completions reported in the new housebuilding series in Table 244; but in 2009-10, such reported completions were only 3.6% higher (Column C of Annex Table One).

The ONS series likewise consistently undercounts recent new build activity and is incomplete insofar that data from Wales is missing.

The new housebuilding series began in 1946 solely based on local authority building control. National House Building Council (NHBC) data was added from 1985 and then 2007 legislation then allowed data from independent approved inspectors.

The sources of the series data accordingly remain building-control-based, considered the best source to identify the start of new build dwellings (specifically the commencement of construction in laying of foundations) and the timeliest measure of new build completion (as measured by the completion certificate), but in recent years building control-based sources have become increasingly fragmented, contributing to the partial coverage problem identified above.

DLUHC statisticians make allowances for non-response (reported as 78% for independent approved inspectors in Q1 2023) through a process of imputation from past returns, revising the series when late returns are submitted.

The technical notes accompanying the series recognises, however, that data coverage in terms of late and non- reporting is a problem – one that demonstrably has and not resolved by the imputation process.

Although the DLUHC has produced a one page guide to housing statistics which shows users how the new housebuilding series relate to other releases, the precise reasons for the under-reporting of new completions by this series remains to be accurately determined, reported, and rectified, while its seriousness and impact appear to be downplayed by both the DLUHC and ONS.

2          Guidelines and recommendations for the future

That the net new supply series provides the best measure of not only new net supply but also for new housebuilding completions since April 2006 has become progressively better recognised over recent years. It remains, however, a lagged backward-looking metric that does not cover starts.

Although flagged as such by the DLUHC in the relevant official releases, this website considers that the department should go further and advise users that the new housebuilding series should only really be used for two reasons.

First, to consider longer-term trends prior to 2006-2007.

The DLUHC interactive dashboard published within its indicators of new supply (new housebuilding) series, reproduced in , reports new build completions according to the tenure of provider from building control sources until 2005-2006, but subsequently by final tenure using the more accurate net supply and affordable housing series. It should be updated and highlighted in future new net supply and new housebuilding releases and perhaps be made a live table.

Second, as a leading but inadequate indicator of new starts.

Given that recent trends in housebuilding activity are an important determinant of wider macro-economic as well as of future housing market outcomes, greater accuracy new build start data is certainly required if it is to provide a fit for purpose leading snapshot indicator of the direction and scale of current and near-future new build activity.

This will probably require a shift to a mandatory site-based time-sensitive reporting requirement placed on the housebuilder backed up by the necessary enforcement and associated political commitment.

On an interim basis DLUHC/ONS should actively consider on how best to mitigate the demonstrable undercounting of new build starts by the series and upgrade its risk rating.

The net new supply series does not breakdown according to tenure, a drawback related to the problem that the provision totals reported in the affordable series are reported gross, not taking account of dwelling losses resulting from sales, demolitions or from other causes.

That series thereby does not report actual net affordable supply – a fraction of the gross completion totals subject to official fanfare and political soundbite.

This should be kept well in sight, which future affordable housing series could more clearly and transparently highlight.

The DLUHC meanwhile is undertaking work to address a request from the July 2020 recommendation by the Housing Communities and Local Government select committee “on publishing net supply of affordable housing by tenure”.

The ancillary information it has produced – as reported earlier – on net affordable additions by tenure should be both further developed and reported and/or cross-referenced should be moved to the annual net supply and affordable housing release commentaries , as appropriate, as should the accompanying commentary on sales and demolitions, rather than be buried in the technical notes and dashboard of the indicators of new supply series (really the new housebuilding series: the one, as above, that needs a stronger health warning!)

In that light, Annex Table Seven could be updated and customised in parallel with the progressive and timely development of the new experimental flow-based series as an addition to the annual net supply and affordable housing series, insofar that stock-based figures are likely to become less accurate as the decade progresses towards the next 2031 decadal census adjustment.

Annex Table OneDownload
Annex Table TwoDownload
Annex Table ThreeDownload
Annex Table FiveDownload
Annex Table SixDownload
ANNEX TABLE SEVENDownload

Share this:

  • Click to share on X (Opens in new window) X
  • Click to share on Facebook (Opens in new window) Facebook
  • Click to print (Opens in new window) Print
  • Click to email a link to a friend (Opens in new window) Email
  • Click to share on WhatsApp (Opens in new window) WhatsApp
  • Click to share on LinkedIn (Opens in new window) LinkedIn

Filed Under: Housing Tagged With: statistics

The New Infrastructure Levy (IL): Going Round the Mulberry Bush

1st July 2023 by newtjoh

Section 1 of this extended post describes how S106 accidently evolved into the primary source of affordable housing, as Table 1 shows, then reports its identified shortcomings, before pointing out that progressive improvements in S106 practice, attributable to the use of standard templates, learning by doing and from experience, and greater consistency and certainty in national and LPA policy and practice, has weakened the force of some of these criticisms, while alternative mechanisms proposed across successive consultation cycles suffer from their own problems.

Section 2 describes the design and policy history of one such mechanism, the Planning Gain Supplement (PGS) proposed in the 2004 Barker Report and why it was stillborn.

Section 3 described the design and operation of the Community Infrastructure Levy (CIL) and how it was undermined by political mismanagement and neglect related to a lack of overarching commitment to first order objectives, including increasing infrastructural investment closer to needed economic and social levels, and by

design problems, identified in Table 2, that not only afflicted CIL but are inherent to any land value capture mechanism that aims to combine the advantages of national policy certainty with needed local flexibility in implementation.

Section 4 describes the proposed new Infrastructure Levy (IL), its possible advantages which, however, depend upon assumptions that tend to conflict with reality on the ground while it could introduce further complexities and problems, and/or replicate the problems encountered by CIL, before noting that the absence overarching political commitment to increased levels of local infrastructural and affordable housing will render any mechanism ineffective.

Section 5 concludes that the upheaval, confusion, and policy blight that would follow the introduction of replacement IL proceeding fitfully in parallel with the existing CIL and S106 systems withering on the vine for a decade or more, is likely to result in more harm than good. The lesson of the CIL implementation process was clear enough and should be learnt this time round.

It follows that incremental reform to, rather than a complex replacement of, the existing ‘present imperfect’ CIL and S106 systems, focused on the issues identified in Table 2, seems to offer a more sensible way forward.

Such changes should include setting clear process arrangements for the forward financing public funding of infrastructure to help to ‘crowd-in’ future development, the definition and application of development viability with reference to land value mechanisms (whether IL, CIL or S106) that can best reconcile national certainty with needed local variation,  securing greater consistency of, and certainty in the application of S106 affordable housing contributions at both central and local levels in a way that could tap effectively into the potential for increased land value, where that was present.

1      Section 106 obligations: an accidental provider of affordable housing

Section 106 planning obligations (S106) are legally enforceable contracts between local planning authorities (LPAs) and developers. They specify the contributions required to make specific developments acceptable in planning terms.

These contributions can be made in cash or kind and can include specific items of infrastructure, such as access roads, new junctions, or, in the case of the largest developments, even new health and school facilities where these are required by the new development in question, as well as more generally affordable housing.

Developer affordable housing contributions involve the provision of a designated proportion of dwellings on affordable terms to a social landlord, including direct on- or off-site provision of rented and discounted low-cost home ownership units, on- or off-site provision of land for free or at a rate below market value, or by making commuted monetary payments or other contributions.

S106 contributions take their title from Section 106 (inserted in by Planning and Compensation Act 1991) of the the Town and Country Planning Act 1990 (TCPA1990).

It provided LPAs with the specific statutory power to, and consolidated the process by which they could require obligatory contributions (commitments) to make schemes or projects acceptable in local planning terms.

Planning obligations (Section 106 or S106) could now be attached to a planning permission or derive from a unilateral undertaking – usually made by developers at planning appeals.

Section 52 of the Town and County Planning Act 1971 had earlier specifically empowered local planning authorities (LPAs) to make a planning permission(s) conditional on an applicant(s) entering into a legally binding planning agreement(s).

Despite the enactment of TCPA1990, planning agreements and conditions sometimes continued to be used in an ad hoc, and, at worst, arbitrary way, raising concerns about a form of ‘legalised bribery’ taking place.

Permissions, for instance, for out-of-town shopping centres, could be, in effect, auctioned to the developer offering the best ‘deal’ to fund infrastructure and facilities that were neither necessarily materially related to the development in scale or kind, nor integrated or consistent with the relevant Local Plan (LP) – see, for example, May 1995 House of Lords case.

Government circulars, departmentally issued to provide non-statutory policy guidance on the local implementation of legislative measures and which can provide material considerations to LPAs to consider when making planning decisions and to the Planning Inspectorate or to the courts when reviewing such decisions, often covered such concerns.

Circular 16/91, circulated in the wake of TCPA 1990, confirmed the government’s policy position that obligations should only be sought or made when a direct relationship between such obligations and the proposed development was established, and when these obligations fairly and reasonably related in scale and kind to the same development – a position sometimes termed, rational nexus, that has since hardly changed.

 It also highlighted that the term ‘planning gain’ – capturing for public gain a share of the uplift in development value attributable to a planning permission(s) – neither possessed statutory significance nor backing within the planning legislative framework, specifically cautioning LPAs not to seek cash or in-kind payments for purposes not directly related to proposed developments.

However, Circular 7/91: Planning and Affordable Housing, began to plough a parallel furrow, by extending the policy scope for LPAs to use S106 as a significant source of local affordable housing supply.

It confirmed that a “community’s need for affordable housing is a material planning consideration that may properly be taken into account in formulating local plan policies”, and “they (such policies) can properly be used to restrict the occupation of property for people falling within particular categories of need”, although it went on to add the rider that “planning conditions and agreements cannot normally be used to impose restrictions on tenure, price or ownership”.

Paragraph 12 of  Circular 11/95 then made it clear that where it was possible to for a LPA to use either a planning condition or an obligation(s) then it should use the former, as the latter precluded the developer appealing against its imposition.

Notwithstanding its official discouragement of using planning obligations, the same circular also indicated that planning instruments could be used, in effect, as tool of housing policy, although some ambiguity remained (the circular was issued to reflect case law precedent, rather than to declare a new policy direction backed by government commitment: see last sentence below), with its para 97 advising that:

“The courts have held that the community’s need for a mix of housing types – including affordable housing is capable of being a material planning consideration. It follows that there may be circumstances in which it will be acceptable to use conditions to ensure that some of the housing built is occupied only by people falling within particular categories of need. Such conditions would normally only be necessary where a different planning decision might have been taken if the proposed development did not provide for affordable housing and should make clear the nature of the restriction by referring to criteria set out in the relevant local plan policy. Conditions should not normally be used to control matters such as tenure, price, or ownership”.

 Margaret Thatcher’s Conservative governments during the eighties curtailed council house building programmes while post-1980 Housing Act Right-to-Buy programmes dwindled their existing stocks.

Housing associations (now Registered Providers, RPs) became the primary source of new social housing let at sub-market rents during the eighties, but at much-reduced volume levels.

Their main funding source was capital housing grant – then called Housing Association Grant (HAG), now known as Social Housing Grant (SHG) – channeled through a public agency founded in 1974: the Housing Corporation (now Homes England).

Although post-Thatcherite governments continued to direct public spending away to other social spending programmes, they did, however, recognise the need for additional affordable housing supply to increase.

In that political light, from the end of the eighties onwards, RPs were given greater freedoms to borrow privately to supplement public grant support, allowing them to ‘stretch’ supply levels, even as the percentage of scheme costs met by grant progressively reduced.

The planning system also came into steadily larger view as an alternative potential mechanism to expand affordable housing supply.

Circular 13/96 acknowledged that a practical way of ensuring long-term control over ownership and occupation was to involve registered housing associations in the provision of the new affordable housing using planning (affordable housing) obligations.

Circular 6/98 reduced the threshold below which it would be inappropriate seek affordable housing obligations to 25 dwellings, save that for Inner London or across other areas “where a robust housing needs assessment provided evidential support for a lower threshold”, a lower 15 dwelling threshold was set. It is now ten dwellings.

Not only was the base on which S106 affordable housing obligations could be levied broadened, but the proportion of social housing completions that used a mix of public and section 106 support (partial grant) rose, as the proportion funded solely from public grant fell.

The shift to the use of S106 as a supplemental and then as an alternative funding source to public grant accelerated as the new millennium progressed.

Evidence submitted to House of Commons in 2011-12 indicated that the number of new affordable homes approved through S106 obligations more than trebled from just under 14,000 in 1998–99 to peak at over 48,000 in 2007–08. An estimated 80% of these approvals were subsequently actually delivered.

As Table 1 reports (itself collated from Table 1000C  of the official affordable housing statistical series) the proportion of social rented completions accounted for by nil grant S106 also steadily increased from three per cent in 2002-3 to reach 11% by 2008-2009.

Yet, the future role of S106 remained confused, contested, and fluid on the central government policy development stage.

In December 2001, New Labour’s newly re-elected second term government published Reforming Planning Obligations: A consultation Paper – Delivering a Fundamental Change (DTLR, 2001) that criticised the S106 process, proposing that to secure a “faster, more efficient and more effective planning system”, LPAs should instead use more standardised and generalised tariffs rather than individually negotiated S106 agreements, which in future should be limited to where they were “clearly justified to deliver, for example, site-specific requirements”.

But within two years, in November 2003, another consultation document: Contributing to Sustainable Communities – A New Approach to Planning Obligations, proposed that LPAs should be empowered to offer an upfront pre-set “optional planning charge”, set in advance but variable between LPAs and between different types of development, which developers could choose to pay as an alternative to negotiating both S106 planning and affordable housing obligation(s).

That new policy proposal, in turn, was put on ice by the publication in March 2004 (following an interim report in December 2003) of the Barker report that Section 2 will discuss.

The then-prevailing view on planning obligations was generally lukewarm at best, marked by a sense that their unpredictability and uncertain impact justified a shift towards alternative mechanisms, such as up-front standard and fixed tariffs.

Shelter, for example, had, in its response to the government’s December 2001 consultation, stated that “We agree with the government’s analysis of the faults of the current system of planning obligations. We consider that a ‘tariff’ system will offer much in the way of clarity of expectations on developers, faster procedures, and easier quantification of the benefits and how they are applied”.

Circular 05/2005  was published into this slipstream of prevailing and continuing policy uncertainty concerning the future scope and coverage of planning obligations.

While confirming the optional planning charge outlined in the November 2003 consultation would not be introduced until the government decided its response to the 2004 Barker report, including to her flagship PGS proposal, its focus was rather on the policy acceptability of planning obligations and the process/procedure used to negotiate and secure them in the context of the “improvements to the current system which the Government would like to make in the interim period before further reforms are brought forward”.

In practice, the circular remained extant – as did Circular 11/95 – until it was replaced by the National Planning Policy Framework in March 2012. It thus proved more of an unintended consolidation and watershed than an interim response.

Its Annex B reaffirmed that that planning obligations could be used to:

  • prescribe the nature of a development, such as requiring a proportion of a development to be affordable;
  • compensate for loss or damage caused by a development, such as a loss of an amenity by securing in-kind or cash from a developer;
  • mitigate an impact of a development, for example, through the funding of transport, health, or educational provision improvements to “make acceptable development that otherwise would be unacceptable in planning terms”.

 A ‘functional or geographical link’ between such obligations and the development should exist save for affordable housing, and they should be “fairly and reasonably related in scale and kind to the proposed development and reasonable in all other respects”.

 The Global Financial Crash (GFC) then intervened to throttle the housing market and thus reduce the scope for developers to cross subsidise affordable housing from market sales. Many developments stalled and even across developments that were then subsequently built out S106 affordable housing obligations were often scaled back or not implemented.

Many commentators argued that public investment in affordable housing should be increased as part of a classis Keynesian domestic counter cyclical fiscal response to the GFC.

Housing capital expenditure instead took the brunt of fiscal austerity measures that George Osborne, chancellor of the 2010-15 Conservative and Liberal Democrat government, put in hand to ostensibly reduce the deficit but also part of a wider strategy to ‘shrink the state’.

Average grant levels were cut by up to 60% in total. Funding for new social rented housing – largely replaced by an affordable rent sub- tenure offered at c80% rather than 50% market rental levels – ended as policy presumption shifted towards providing affordable housing without public grant subsidy.

RPs, working in partnership with both councils and developers, were forced to work ever harder to devise and implement new affordable housing provision and funding models.

This turbo charged the tendency already begun during preceding decades for RPs to become developers of schemes, using sales of market housing to cross-subsidise rented dwellings let generally at sub-market levels, to purchase dwellings off-peg from developers to then offer on affordable terms, often in accordance with S106s agreed and made with LPAs.

An associated and intensifying secular trend was for such developer RPs to grow larger in size and turnover through takeovers, consolidation, and merger, as well as from organic growth. This was to increase their borrowing capacity and balance sheets and to benefit from economies of scale and scope.

The impact of fiscal austerity on national affordable housing capital budgets and on local budgets generally meant that when the housing market again took off at least across economically buoyant and areas concentrated around London and other high housing value areas that RPs increasingly relied on nil grant S106 to provide social housing.

Nil grant S106 affordable completions increased more than fivefold from a 2011 trough, occasioned by the GFC, to exceed 30,000 during 2019-20 – accounting for more than 50% of total affordable completions that year (see previous link to Table 1).

Between April 2017 and March 2021, the proportion of social rent completions enabled by nil grant S106 in England exceeded 50% each successive year, while for intermediate tenures, the proportion so enabled touched 65% in 2017-18, although subsequently that proportion has dropped.

S106 without public grant had become the primary funding source of affordable housing: an essential component of the mixed public and private funded welfare state across the housing sphere.

In many ways, a remarkable outcome. It represented, at first glance, a part privatisation of the funding of social and affordable housing, enabled by locally negotiated S106 agreements that, in effect, represented a locally levied and collected development tax or charge on speculative market developments, with its value or proceeds provided-in-kind or hypothecated for local affordable housing as a contractual commitment(s) linked to specific development(s) .

These outcomes were a product, not of first order political design or agency or competing party ideology or preference, but primarily one of incremental pragmatic responses of stakeholders responding at a local level to the inability of both the housing market and the planning system to deliver affordable housing or balanced communities in tenure and social compositional terms and to changes in the wider political and policy environment.

Planning policy at a national level initially largely followed evolved practice on the ground ratified by judicial case law decision, and then responded to conditions of post-GFC fiscal austerity.

S106 was also not specifically designed by central government to effectively recycle windfall landowner and development gains into affordable housing and other public purposes; indeed, until the nineties using it for that purpose was officially discouraged, if not prohibited.

The academics that have advised the government and House of Commons select committees on mechanisms to capture land value estimated that by 2018 that c30% increased land value resulting from residential development of greenfield sites was captured by the combined operation of CIL and S106, with up to another 20% captured by national capital gains and stamp duty land taxes.

The accidental antecedents of S106 partly explain why the level and composition of developer affordable S106 contributions lack predictability, related to uncertainties caused by contingent market conditions, top variant site attributes and circumstances, to the availability or otherwise of SHG, as well to the relative negotiating position/skills of the parties.

The process overall has tended to be piecemeal, reactive, cumbersome, hampered by the fact that information that is shared between the parties has tended to be asymmetrical and imperfect.

The non-exhaustive list of problems catalogued below have often cited in successive consultations by both government and stakeholder respondents as a reason to replace S106:

 obligations are mostly attached to major housing schemes that many authorities only infrequently face and progress, causing problems related to LPA lack of experience and capacity in dealing with such applications;

  • the complexity of such large-scale schemes and lack of policy certainty on contribution amounts and rates can result in protracted negotiations that consume much local authority and developer time and other resources, to the especial detriment of small and medium housebuilder enterprises (SMEs);
  • asymmetries in negotiating expertise exist between the two parties, leading to unsatisfactory public policy outcomes related to above, for example, Southwark case example;
  • a site- and locally negotiable system, rather than one subject to certain requirements known in advance, mean that both local authorities and developers are not always aware of the level of planning contributions that might reasonably be expected from a given development, resulting in obligations varying between areas and applications otherwise substantially similar;
  • besides such local discretion in treatment, such variation is an inevitable by-product of a process sensitive to changes in market conditions (a rising or falling housing market impinges on development values and developer profits and hence perceived, claimed, or actual scheme viability) that can also result in substantial downward negation or revision of previously agreed negotiations as, for instance, did occur in the wake of the GFC, and could be occurring now with the recent housing market downturn;
  • affordable housing levels achieved on a site-by-site and LPA level can therefore diverge markedly from published local policy requirements, which in the past has and can lead to developers to assume less than policy compliant levels of affordable housing when bidding for land, resulting in higher land prices and development costs generating a self-fulfilling circular process;
  • A stated headline affordable policy requirement – say 35% – in any case cover a range of compositional permutations of social rented and intermediate tenure options that in realisation vary in value to the LPA and in cost to the developer both over time and between LPA’s;
  • associated problems of lack of process transparency;
  • other potential sources of contribution, including commercial and smaller developments, are left untapped;
  • S106 scheme contributions towards community infrastructure and/or site mitigation can be meshed more to stakeholder budgetary imperatives rather than local needs;
  • possible tendency of some local authorities to misuse Section 106 to delay or discourage development, by asking for unreasonably onerous levels of developer contributions;
  • possible generation of perverse incentives in favour of high-density housing schemes deemed most likely to maximise contributions and to protect developer profit levels, thus risking over-development or sub-optimal social outcomes, such as compressed space and other standards;
  • long time lags between the negotiation, the agreement, and the receipt of contributions;
  • inadequate monitoring of the delivery of originally negotiated obligations, whether due to their renegotiation, to changes to planning applications or their non-progression in full or part, or to simple shortfall when the development takes place, can result in LPAs not getting the full benefit of contractually committed obligations. A May 2022 audit of affordable housing delivery,  annually undertaken by the London Borough of Southwark, for example,  identified in 21 cases of apparent under-provision of social rented units and 39 pertaining to intermediate, with another nine no responses, indicating a potential significant under delivery problem. There is little or no reason to suppose that a similar problem does not exist across other such authorities.

This long and apparently damning inventory of problems and issues associated with S106 fails, however, to recognise the progressive improvements in practice, such as use of standard templates, learning by doing and from experience, and the movement towards more consistency and certainty in national and LPA policy and practice, all of which has gathered pace in recent years.

Focused initiatives such as the Mayor of London’s Affordable Housing and Viability Supplementary Planning Guidance (2017 SPG), incorporated into the 2021 London Plan, that introduced a streamlined Fast Track Route for applications that include commitments to provide at least 35% cent affordable housing, and 50% on public or redeveloped industrial land has provided greater policy certainty to developers and London LPA’s hat by embedding the costs of defined and more certain affordable housing requirements into land values has served both to increase the level of achieved contributions and to speed up the planning process.

Recent proposed June 2023 updates to London Plan Guidance (LPG) on  Affordable Housing  and Development Viability  also provide pointers to future replicable good practice.

Undoubtedly S106 is a second-best public policy response to the need to fund and provide additional affordable housing and connected local cumulative infrastructural requirements.

But that bald statement begs the question as to what is and would be the best response.

The parallel and co-ordinated reform of public and private and business models to mainstream affordable housing provision most efficiently at optimum volume and public subsidy levels combined with a distributional fair land value tax attached with minimal distortionary economic deadweight effects would be one candidate. Like others, however, it is not immediately realisable for a mix of political and institutional reasons.

And an evolved and known second best is still better than third or fourth best or even possibly improved second best alternatives that, however, will involve upheaval and are uncertain in outcome.

At root such alternatives will suffer also from similar or other problems intrinsic to all land value mechanisms that seek to combine certainty with flexibility, when a ‘one-size fits all’ approach rubs against the reality of divergent spatial and site characteristics and circumstances, as subsequent sections will now go on to demonstrate.

2          Barker’s Planning Gain Supplement (PGS): a partly hypothecated national tax to support local infrastructural funding

Gordon Brown, a chancellor forever focused on stamping his authority on New Labour domestic policy, appointed Kate Baker, a former Bank of England economist to examine how improved supply responsiveness of the housing system could reduce the impact of rising real house price levels on the wider macro economy.

Her March 2004 (following an interim report in December 2003) Barker Review Final Report (Barker) concluded that Section 106  in its existing form it “did not offer the best method to achieve needed higher levels of housing supply”.

 It proposed a national direct levy or tax on development betterment – the Planning Gain Supplement (PGS), to be levied when full planning permission was granted.

Barker envisaged that PGS would generate proceeds sufficient to cover the estimated Section 106 contributions that (in the absence of PGS) would have been made plus additional resources to boost housing supply and for associated infrastructural and other requirements but set not so “high to discourage development”.

Section 106 planning obligations (S106) could then be “scaled back” to cover site-specific impact mitigation and affordable and/or social housing requirements only (R24).

To finance their wider cumulative infrastructural requirements, Barker envisaged that local authorities (LPAs) should receive from central government a direct but unspecified share of the PGS proceeds generated within their areas.

Should the government decide against introducing PGS, Barker suggested that it alternatively should then press ahead and introduce instead an up-front pre-set and fixed tariff or charge that could still be set to vary between LPAs and types of development, however.

This had been proposed in the November 2003 consultation document Contributing to Sustainable Communities – A New Approach to Planning Obligations” that developers could choose to pay on a scheme-by-scheme basis as an optional alternative to negotiating S106 planning and affordable housing obligation(s).

However, Barker emphasised that this alternative was a second-best response that was likely to involve continuing prolonged and costly section 106 negotiations covering large and complex schemes.

As is conveyed by the above, Barker painted her canvas with a broad brush, leaving much of the crucial detail left to be filled in later, including:

  • the difficulties of establishing the point in time when the uplift in value on which PGS should be levied;
  • whether the computation of current use value should reflect ‘hope value’; (projected planning uplift attributed to an expected or possible future planning permission);
  • whether PSG should be levied on the landowner or on the developer or on both;
  • the precise and respective future coverage and impact of PSG and Section 106 on affordable housing provision;
  • the impact of a national uniform tax levy on the development viability of sites possessing variant geographical, locational, and physical characteristics;
  • whether low value brownfield development should be exempted;
  • the PSG rate itself, and whether it should be a uniform UK rate or made regionally or locally variable, or applied differently across the devolved administrations;
  • whether it should be applied across all developments save for householder improvements, or be targeted towards housing developments above a defined minimum threshold value;
  • whether the supply of land available for development would be reduced by landowners withholding it as PGS was capitalised into lower land prices;
  • whether, and in what proportion, PSG should be re-distributed between authorities, rather than simply directly allocated back to the originating LPA;
  • the need or otherwise for transitional arrangements to cover existing planning applications and industry practices, such as option agreements, where the developer had had paid the landowner for an option to purchase their land in the future.

The canvas then began to be filled in by a chain of government consultations, select committee reports, subsequent responses, and then policy announcements pertaining to PSG, including the HM Treasury response to 2005 consultation; the 2006 Pre-Budget report; the  Planning Policy Statement 3  (PPS3) issued  in November 2006; Planning Obligations: Practice Guidance; the November 2006 Select Committee Report on PSG; the Government response to November 2006 report; the Changes to Planning Obligations December 2006 consultation; and the  November 2007 government response to Valuing and Paying for PSG consultations.

The upshot, broadly taken across the piece of that process, was that PGS, when implemented, should:

1          Be set “at a modest rate across the UK” – some commentators took that to mean c20%: in short, a simple and modest (depending on viewpoint and/or interest) flat rate national tax on development, provided with limited exemptions.

Alternatives could include a lower rate for brownfield sites possibly supplemented by tax reliefs or credits targeted to support urban regeneration, “subject to further investigation”.

2          PGS revenues should be separated from the local government funding settlement.

At least 70 per cent of PGS revenues sourced from a local area should be hypothecated (ear-marked) to support infrastructure priorities within that same area.

3          Liability for PGS would not arise until after a developer – following the granting of full planning permission – had applied for a PGS Start Notice, signifying that they intended to commence site development.

4          That liability would then be calculated by subtracting the current actual use value (CUV) of a site (actual site values were preferred over taking a measure of average local values due to their variability and heterogeneity – each site is different – from its post-planning permission value (PV).

So: (PV – CUV) x PGS rate (%) = PGS liability.

Two separate valuations therefore would be required to determine PGS liability: one, to establish the CUV of the development; and the second to establish its PV.

5          PSG for each eligible site was to be paid by its developer (the entity implementing the planning permission) on the assumption that it possessed a notional unencumbered freehold interest with vacant possession (FHVP) of the site in question.

The government had concluded that site developers were best placed to accommodate the costs of PGS during the normal commercial negotiations they concluded with landowners to bring sites into development.

Having only one legal entity to account to HMRC for the site PGS liability, it was envisaged, would simplify the valuation process.

6          Section 106 should be scaled back to cover only “direct impact mitigation” at the site level, including the physical environment of development sites: their access connectivity; the direct mitigation of any arising adverse environmental impacts, relating, for instance, to landscaping, or other specific archaeological, environmental protection considerations; or other related site requirements.

The crucial – albeit by then established – exception was that securing affordable housing in a residential or mixed-use development at a proportion set within the relevant Local Development Framework (LDF) Plan should remain within the scope of S106.

7          The provision of such affordable housing was considered to constitute an on-site delivery issue that needed to be integrated from the outset into the site development process.

This was considered consistent with the wider achievement of mixed communities, in terms of their tenure and price offer, as well as their household compositional mix, including families with children, single, and older people.

The November 2006 PPS3 (see earlier link) had required LPAs to set an overall (plan-wide) affordable housing target(s), split, where appropriate, between social and intermediate housing categories, based on “an assessment of the likely economic viability of land for housing within the area, taking account of risks to delivery and drawing on informed assessments of the likely levels of finance available for affordable housing, including public subsidy and the level of developer contribution that can reasonably be secured”.

This represented an official acknowledgment that S106 affordable housing obligations had become integral to national and local affordable housing provision supply.

The national minimum indicative minimum size threshold for such affordable housing obligations was reduced to 15 dwellings. Local authorities, however, were offered the discretion to set a lower threshold, where that was “viable and practicable”.

8          Social or community infrastructural requirements, including leisure, educational, health facilities, in future, would fall outside scope of Section 106, to be funded from PGS or other sources.

In summary, to meet three different requirements:

  • the on-site mitigation of adverse consequences of development;
  • the funding of local infrastructural requirements connected with new developments;
  • the provision of local affordable housing,

the government, on the back of the Barker report, proposed two primary policy instruments.

First, S106, scaled down to the still considerable twin-tasks of making a development acceptable in planning land use terms and of expanding affordable housing supply.

Second, a mechanism, PGS, a national tax on the uplift in site development values when crystallised by relevant planning approval(s), to fund necessary supporting community infrastructure.

The cumulative infrastructure funding issue

Site-related planning considerations can straddle wider community-related educational, transport, and other infrastructural needs.

Take, for instance, a site access connector road – clearly a site-related consideration – feeding into a new relief road, where that, given the expected impact of the new development on traffic flows, was also assessed as necessary to reduce congestion across the wider settlement spatial area,

When built, however, such a relief road could well reduce future traffic congestion within the wider area – even with the addition of the traffic generated by the new development, to below to what was experienced before it was built – at least if and until a new congestion ‘tipping point’ was reached when congestion became worse than it was before it was opened.

A new level crossing or road bridge over a railway that Network Rail, for instance, deemed necessary due to the increased traffic it expected a new development would generate, is another example of such a ‘tipping point’ effect.

They can apply to increased provision of school places, GP surgeries, and other items of community infrastructure that expand future system capacity across a wider pool of users than future residents of a proposed development but are lumpy in terms of their associated fixed cost requirements, when may not always be possible or appropriate to expand provision incrementally on existing sites, such as providing a new classroom.

Logically, these ‘tipping edge’ and ‘cumulative funding’ problems can be overcome – and often are – by a S106 contribution made proportionate to the assessed impact of a new development on existing and future local cumulative infrastructure needs,

Indeed,  B21-24 of Annex B of Circular 05/2005  advised that LPAs should set out in advance the need for such wider (not confined to individual site mitigation purposes) supporting cumulative community infrastructure, such as health and educational facilities, and the likelihood of a contribution towards them being required.

In such cases, a direct relationship between the development and the supporting infrastructure required and that the contribution sought was fair and reasonable in scale should be both demonstrated. A clear audit trail should then be maintained between the contribution made and the infrastructure provided.

It went on further to say that developer contributions could be pooled, if necessary,  across different developments and local authority areas and that “In some cases, individual developments will have some impact but not sufficient to justify the need for a discrete piece of infrastructure. In these instances, local planning authorities may wish to consider whether it is appropriate to seek contributions to specific future provision”.

Yet such contributions, especially when they need to be combined with existing LPA and/or external agency resources available for infrastructure works, often prove insufficient to allow the desired infrastructure to proceed prior, or in parallel, with site development.

They can also prove difficult to quantify and apportion to individual items of infrastructure and on what planning and provision basis.

Whether the impact of the development on needed infrastructural provision constitutes a ‘tipping point’, can consequentially risk become becoming a source of negotiating complexity, contention, and delay.

In the case of the relief road example, if the contribution only augmented the existing pot available for such a project but not enough to allow it to proceed, congestion would worsen in the meantime. Similarly, school and GP surgery excess demand and overcrowding could result.

Such ‘tipping point’ and associated cumulative funding co-ordination problems are increasingly highlighted or even exploited as reasons to resist such new development, as discussed in The 2020 Planning White Paper: Key Lessons. 

PGS, development viability and affordable housing obligations

Another issue not resolved by the post-Barker consultation policy development process was the extent that the retention of section 106 affordable housing obligations could be supported and paid for by developers within a new regime that also included PGS.

In short, could a PGS levied, at say, a national 20% cent uniform rate across England co-co-exist with S106 affordable housing as well as some limited site mitigation obligations, without its introduction undermining the viability of future developments and then ultimately housing supply?

The 2007-2010 Brown government itself recognised that for section 106 to operate effectively in parallel with PSG, then the legal, policy, and funding pegs on which affordable contributions were to be hung needed to be made clearer and more certain, concluding that “a contribution by the developer in the form of, or equivalent to the value of, the land necessary to support the required number of affordable units on the development site would represent a reasonable starting point for negotiations”.

That treatment, however, still left open on how such land contributions could be combined with the proposed PSG, as well as other valuation issues connected to geographically or spatially variant land values.

As it turned out, the proportion of planning obligations accounted for by land contributions progressively fell over subsequent years.

Why did the PGS fail even to reach the runway?

Post-war policy experience of taxing development betterment values at a national level was not encouraging.

The three main legislative attempts to do so in 1947, 1967, and 1976 proved singularly unsuccessful, both in terms of revenue raised and in securing greater land supply for development.

Developers held back on the expectation that the high levels of tax involved (100% in 1947) would prove unsustainable and would be reversed by a successor government.

The prospects of the future success of PGS were, therefore, not promising from the outset.

Notwithstanding the lower rates envisaged by Barker, PSG could still involve a disincentive for developers to seek permission, or then to start work.

Practical issues concerning its timing also remained unresolved.  The post Barker consultations proposed that valuation would occur when full planning permission was granted for a development with payment due 60 days after works commenced.

But development values could change between the date that planning permission was granted for the development and the date when it commenced: the scope and cost of remedial or other site preparation work could increase, for instance.

The largest developments also often involve multi-phasing over a prolonged period, the treatment of which would have likely complicated the operation and timing of PGS, quite likely encouraging developers to structure and sequence schemes to minimise their liability to pay it.

Alternatively, if PGS was assessed against final development value, measurement and timing issues could remain, while a delayed receipt profile could prove a problem for LPAs needing to fund supporting infrastructure – especially if they were prevented from forward-financing such works.

These issues will likely pertain to the emerging new Infrastructure Levy, discussed in Section 4, when introduced.

In any case, a hammer was thrown into the post-Barker policy development process when the 2006 Pre-Budget Report indicated that PSG would only be implemented, if “after further consultation it continued to be deemed workable and effective; and, in any case, no earlier than 2009”.

Hardly a ringing commitment to begin with, reflecting doubts within and outside government as to whether PGS was workable.

Delaying the earliest date of its introduction to the year prior to a general election, in effect, represented a pre-announced death sentence for PGS.

Developers, unsurprisingly, exploited the enveloping uncertainty to mobilise against PGS, with their lobbying efforts coalescing around the introduction of alternative standardised tariff approaches, involving a fixed per square meter rate, rather redolent of the standardized tariff approach that had been proposed in another earlier December 2001 Reforming Planning Obligations consultation.

Some LPAs, including Milton Keynes and Ashford, responding to continuing central encouragement to “experiment using such standard charges”, did set such tariffs.

The most high-profile example was the Milton Keynes ‘roof tax’. It involved a fixed tariff set at £18,500 per dwelling and c£66 per square meter of commercial floor space and was designed to raise £311m towards the c£1.7bn total scheme costs of extending the UK’s largest and most successful new town.

This tariff, however, did not cover the cost of affordable housing: section 106 contributions of c£316m towards affordable housing were still needed, but overall the tariff was considered an effective and efficient way of funding infrastructure.

Such a proportionate and certain tariff was considered conducive to streamlined development planning and delivery and to securing broader stakeholder acceptability.

But by 2008, the UK, like other advanced economies, was entering the grip of the Global Financial Recession (GFC) that, inter alia, threatened to bankrupt the domestic housebuilding industry.

An election was also approaching, when, for the first time for a generation, the formerly hegemonic New Labour ‘project’ – already running out of political steam and ideas – faced the real prospect of electoral defeat.

Whatever remnant government enthusiasm for PGS rapidly ebbed away until it was finally put out of its misery and discarded in favour of the Community Infrastructure Levy.

3      The Community Infrastructure Levy (CIL)

Introduced in the 2008 Planning Act, CIL became operative on the 6 April 2010 through regulatory statutory instrument 2010/48 (CIL Regulations 2010). It was then retained by the incoming 2010-15 Conservative and Liberal Democrat Coalition government. CIL was not adopted in Scotland.

CIL was designed to act as a specific standalone statutory source of local community infrastructural funding (except for affordable housing), replacing the blurred and uncertain role that S106 provided in default for that purpose.

Unlike the previously proposed PGS – a national tax – it was designed to be locally set and collected and to be voluntary.

A 2011 DCLG Overview of CIL laid out the government’s aim and justification for the scheme, setting forth the expectation or hope that it will prove “ fairer, faster and more certain and transparent than the system of planning obligations which causes delay as a result of lengthy negotiations. Levy rates will be set in consultation with local communities and developers and will provide developers with much more certainty ‘up front’ about how much money they will be expected to contribute”, enabling “the mitigation of cumulative impacts from development”.

It envisaged that CIL would be levied across smaller developments untouched by S106, noting that (then) “only 6 per cent of all planning permissions brought any contribution to the cost of supporting infrastructure”.

Regulation 122 linked the Levy to a parallel scaling back of planning obligations, limiting such obligations, save for the provision of affordable housing, to site specific measures directly related to the development, that were fairly and reasonably in scale to it, and were necessary to make the same development acceptable in land use planning terms.

It continues as a core feature of CIL and S106, providing continuity to guidance dating back to Circular 16/91, while putting the treatment of planning obligations that Circular 05/2005 set out onto a statutory footing.

Regulation 123, as enacted in 2010 (later amended, prior to its recension in 2019), prescribed that after a CIL charging schedule (CS) had been approved and published, LPAs could not use a planning obligation(s) to fund or provide items of infrastructure that it had included in its ‘Regulation 123 list’ –  one detailing items or types of infrastructure intended for local CIL funding  –  or where such a list was absent, from supporting the provision of any item of infrastructure (double dipping).

 Otherwise, only five or less planning obligation contributions could be pooled to help fund for an item of infrastructure not locally intended to be funded by CIL and included in its regulation 123 list (pooling restriction).

These restrictions aimed to encourage LPAs to adopt CIL as their future source of funding for local cumulative infrastructural requirements and to confine S106 to site specific and affordable housing provision obligations, avoiding any overlap funding of local infrastructure between CIL and S106, with CIL becoming the preferred vehicle for the collection of pooled contributions.

Pooling restrictions were lifted in 2019, however, while ‘regulation 123 lists’ were superseded in 2020 by a requirement on LPAs to produce annual infrastructure funding statements, defining developer contributions received (both through CIL and section 106 obligations) and detailing how they had been spent.

Subsequent published Guidance in 2014 remains extant, as updated. Its main provisions are summarised below.

  • CIL is a voluntary and local charge on local new development providing over 100m2 additional floorspace – complications, however, soon arose concerning the precise definition and application of additional, occasioning subsequent and successive revisions to the regulations.
  • LPAs must define local CIL rates in a local Charging Schedule (CS). Charges become payable when full planning permission is granted and “material operations” commence on site.
  • CIL charges involve a straightforward pound per square metre rate, but such rates can vary or differentiate according to the type and size category of developments and their area location, as well as to whether it counts as a ‘strategic’ within each LPA (such different charging classes must be defined in the approved CS).
  • Each proposed CS, prior to its formal adoption, is subject to a defined consultation process and to a local viability review/test, followed by a Public Examination.
  • When setting its CS, LPAs are required, according to the guidance, “to strike an appropriate balance between securing additional investment to support local development and the potential effect of the Levy on their viability”.
  • On adoption, CS rates set across each defined charging class are payable as specified and applicable. They are consequently not negotiable nor variably discretionary on a site-by-site basis, outside or contrary to the provisions of the applicable CS.
  • In short, the local LPA decision whether to adopt CIL is voluntary, but CIL liability when due is each development’s intended gross internal metre square floor addition times the applicable rate set out in the CS for that development, indexed broadly in line with construction costs: its application is then not discretionary or variable.
  • Following the enactment of the 2011 Localism Act, LPAs were empowered to design CSs that encouraged the devolution of planning to a more local level, including making provision for the earmarking of a proportion of CIL receipts to support new chargeable development subject to a designated and approved Neighbourhood Plan.
  • The scope of exemption or reliefs from CIL were widened to encompass social housing, charitable, self-build, residential annexes, and additions, and to some cases of demolishment, of refurbishment, and of change in use – these were also subject to subsequent definitional and other regulatory revisions.
  • CIL proceeds cannot be used to fund the provision of local social or affordable housing.

They can, however, fund a very wide range of other local infrastructure, including roads and other transport infrastructure, drainage schemes, flood defenses, schools, hospitals and other health and social care facilities, parks, green spaces, and other environmental improvement, as well as leisure and other local facilities, “arising from the cumulative impact on local infrastructural needs of successive developments, including those made subject to the Levy”.

CIL progress and operation in practice

A  Review of CIL operation and progress commissioned in 2016 but published in February 2017 to accompany the Housing White Paper (HWP), noted that although it had been slow to start, the process of CIL introduction and of CS adoption, five years from its outset, had begun to pick up and accelerate.

Yet, by August 2015 only 93 LPAs (27%) had adopted a CS, reflective of an introduction period marked by frequent and, according to LPA and developer respondents, often confusing, regulatory changes, as touched on above. Another 109 LPAs were identified as working towards CS adoption.

When added to an already onerous and cumbersome adoption process, such changes tended to undermine timely and effective implementation of CIL by LPAs.

The narrowing of the charging base occasioned by the regulatory extension of exemptions and reliefs also prompted complaints from many LPAs concerning consequent loss of potential receipts.

By mid-2015 around 200 (58%) authorities had either adopted a CS or had begun the process to do so: representing a partial and delayed rather than a comprehensive and universal response to CIL, reliant as it was on local introduction and implementation.

Where LPAs, however, had put in place a CS for two years or more, average year-on-year revenue yield, according to the review, had risen from an average of £0.2m per charging authority in 2012-13 to £0.5m in 2013-14, before rising sharply to reach £2m in 2014-15.

That upward but lagged trend from a very low base reflected that receipts could not begin to be generated until the CS consultation, examination and adoption process was completed and then the ensuing time lag between CIL liability notice issue and revenue receipt – an issue that is likely to be repeated with IL.

CIL in 2015, according to respondents, represented a relatively minor development cost of around two to three percent of total market development value. As an average computed across all charging authorities that figure masked higher charges levied on developments across high value areas more able to withstand higher CIL rates.

A more technically-based review,  A New Approach to Developer Contributions, (CIL Review Team Report, 2017 or 2017 Review), also published to accompany the February 2017 HWP, suggested that CIL raised 15% to 20% of cumulative infrastructural requirements, leaving the remainder to be found by LPAs.

Local authorities were then suffering from the concurrent infliction of post-2010 fiscal austerity that reduced some relevant revenue budgets by more than 50%.

This review went on to note that CIL was generally levied only at a “significant” rate on residential and retail development: other commercial uses to encourage local “economic growth” usually attracted a zero or low rates.

Relying on CIL to fund supporting infrastructure for large developments also served to shift development risk onto LPAs despite developers often being best placed to shoulder such risk.

Liz Peace, the chair of that review, in her later evidence to the 2018 Select Committee on Land Value Capture said it was difficult and, for the very largest developments “almost impossible to apply the formulaic CIL approach”.

 Where, for example, a new school was required, developers “did not want to pay that into a pot and wait for the local authority to build you a school in however, any years’ time it would be: you wanted the ability to do that on your site in kind”.

Her review concluded in 2017 that “CIL is a more appropriate mechanism for capturing infrastructure funding to mitigate the cumulative impact of smaller scale developments. However, it would be more appropriate to have maintained s106 as a mechanism for delivering on-site infrastructure requirements for large-scale sites. The issue of upfront infrastructure cost for large-scale sites is still an obstacle to delivery whether under CIL or s106”.

It proposed replacing CIL with a low level, broad but certain and mandatory Local Infrastructure Tariff (LIT): “a twin-track system of a (low level) Local Infrastructure Tariff (LIT) combined with Section 106 on larger sites”.

By bringing smaller and nonS106 sites into the contribution net and thus increase proceeds beyond levels then currently realized by CIL, such an LIT would thus capture the “best of both worlds”, as well as offer regulatory simplification and process streamlining when integrated with the Local Plan process, while the retention of S106 on larger sites would allow more substantial infrastructure needs to be met in a timely manner by the stakeholder/agents best placed to do so.

A standard, but locally sensitive, national £ per square metre formula “pegged and calibrated to local prevailing values”, was suggested, set between 1.75 and 2.5% of the sale price of a standardised 100 square metre three-bedroom family home divided by 100, which the review posited should obviate the need for a complex Public Examination process, removing layers of complexity and potential delay,  and would have a marginal impact on viability within low value areas.

How it would operate in practice was far from clear, however, as the government later highlighted.

The 2017 Review acknowledged that replacing CIL would involve upheaval and associated transitional issues but concluded, in effect, that the certainty provided by a mandatory low level LIT was worth such disruption, even though a low level LIT would generate insufficient resources to pay for affordable housing in addition to much other supporting and cumulative infrastructure requirements, requiring S106 negotiation of affordable housing requirements to continue.

Essentially, the 2017 Review was itself unable to juggle the conflicting pressures that Table 1 will shortly catalogue, most notably that between the advantages offered by certainty and flexibility: a low level certain and uniform tariff set low enough not to undermine development viability across low value areas or development types will not secure the maximum possible feasible land value capture across high value areas/development types and thus require much cumulative infrastructure to be funded by other methods and sources.

Certainly, the government did not take on board the review’s proposals for LIT to replace CIL. It chose instead to undertake a March 2018 consultation focused on the combined operation of section 106 and CIL (2018 consultation), describing the current system of developer contributions “too complex and uncertain”.

The proposals this consultation made were largely limited to “first step” short-term incremental modifications to the existing combined CIL/S106 developer contributions regime.

These aimed to streamline in time and process terms the statutory CIL adoption process, to allow the pooling of section 106 contributions in CIL-adopted LPAs  (later extended to all areas in para 25 of the government’s response to the consultation), along with the publication of annual Infrastructure Funding Statements.

It did flag, however, that “in the longer term… one option could be for contributions to affordable housing and infrastructure to be set nationally, and to be non-negotiable”.

Like the 2017 Review, it also extolled the Mayor of London CIL scheme – a low-level tariff charged across all London boroughs confined in scope to funding key transport infrastructure, mainly CrossRail – as an effective mechanism to finance visible a strategic infrastructural item(s), noting that since its introduction in 2012, £381 million had been raised against a £300 million target, without much fuss.

The Local Democracy, Economic Development and Construction Act 2009 had created and empowered new Combined Authorities (CAs) to carry out the same functions as the Mayor of London (the direct election of metro-mayors for such CAs was also allowed in 2014) and to charge CIL.

By 2016, CAs covering the former county jurisdictional areas of Greater Manchester, South, and West Yorkshire, and the West Midlands, (councils which had been abolished with the Greater London Council, in 1986) had been freshly created to strategically plan and coordinate regeneration and economic development activity across their respective conurbations/sub-regions.

The 2018 consultation, in that light, also proposed that CAs should be empowered to introduce a low-level Strategic Infrastructure Tariff (SIT) on the Mayor of London model to “increase the flexibility of the developer contribution system, and encourage cross boundary planning to support the delivery of strategic infrastructure”.

Subsequent progress on that proved slow, however.  Successive governments have preferred to progress devolution deals with individual CAs.

A later 2020 Review  of the wider operation of CIL and its impact alongside the planning obligations system, confirmed that the tempo of CIL introduction and implementation had continued to quicken during the second half of the decade.

Mainly based on survey responses from LPA and other stakeholders, focused on the 2018-2019 financial year, it reported that in April 2019, just under half – 155 of 317 potential LPA charging authorities in England (after the reorganization and boundary reorganization of that month, and exclusive of Mayoral, Combined, National Park authorities) – were by then charging CIL.

Given that another 67 were progressing CIL, around two thirds of English LPAs, nearly a decade after its introduction, had either adopted or issued a CS.

By 2018-19, the value of CIL levied by LPAs had risen to £830 million (not necessarily collected), with a further £200 million levied by the Mayor of London,

compared to a combined developer contribution (S106 + CIL) figure of c£7bn for that year, including £4.7bn for the provision of affordable housing provided through S106.

The c£1bn contribution made by CIL to that £7bn total remained relatively small beer.

CIL coverage is very geographically uneven. Over half of contributions were accounted for by London and South-East LPAs in 2018-19, reflecting their higher locational development values with nearly all London authorities charging CIL compared to 21% across the North-West.

Many Northern and Midlands LPAs, where development values were generally much lower, were correspondingly less able to levy CIL at significant level, even on residential developments – at least without either eating into potential affordable housing provision or threatening the commercial viability of some developments.

By the same token, CIL rates, when set not to undermine perceived development viability across such areas, were reported as barely sufficient to justify local implementation cost. Lack of local capacity to implement CIL provided a further and related problem.

LPAs in that position have generally continued to shun CIL.

In operation, it remains spatially concentrated – both in adoption and receipt generation terms — within the more economically buoyant and affluent parts of the country that has left some swathes of the country almost untouched.

Was CIL doomed by design or by central government mismanagement and neglect?

Two key deliverables were expected from CIL. First, it should help to streamline the development process and produce associated efficiency and timeliness benefits.

Second, to generate net additional resources for local infrastructural provision without any associated loss in affordable housing provision.

Successive reviews, summarised above, identified long gestations in the CIL adoption process, followed by inevitable delays in building up or augmenting receipts to reach a point sufficient to fund lumpy required community infrastructure items.

When combined with a central proscription on LPAs forward funding infrastructure on the back of future expected CIL revenue flows, these delays put an effective lid on the short- to medium term infrastructural funding capacity of LPAs.

That lid, along with the transitional problems engendered by having to operate in parallel for a prolonged multi-year period the previous S106 system for planning permissions that had been agreed prior to local CIL adoption, were intrinsic to CIL design.

Another problem was that CIL viability testing (assessment of what developers could be expected to pay, depending on assumptions made) was often made across an individual LPA, rather than at a more granular area or project, basis.

The upshot was that viability was often assessed locally on a pan-LPA ‘worst case’ basis, thereby reducing potential total future receipt generation capacity, especially across low value areas, further fueling LPA perception across such areas that CIL was not ‘really worth the candle’ for them.

Frequent changes in the regulations – S106 pooling of obligations and the fluctuating technical treatment of the coverage, extent, and timing of reliefs provided prime examples – caused further confusion and uncertainty for the stakeholders that needed to operate the new system, as did the imposition of second or third order objectives, such as the decadal tack towards neighbourhood planning.

While the discretion and flexibility provided to LPAs in devising charging schedules did, however, provide some scope for variations in local development conditions and values to be taken on board, such local variation lessened certainty: in short, a ‘one-size fits all’ more certain approach rubs against the reality of divergent spatial and site characteristics and circumstances.

Practice could vary significantly between LPA; a tendency that was driven also by differences in local institutional implementative capacity.

Taken across the board, these scheme features tended to confuse, if not discourage, LPA staff and other key stakeholders, including developers, in their implementation effort, dashing initial hopes that CIL would prove “fair, fast, simple and transparent” in operation.

These problems help to explain why CIL remained a work in progress a decade after its introduction, and why it took that long for scheme receipts to even approach the levels that were anticipated at its inception.

Table 2 below identifies issues and problems that will continue to apply, regardless of whether CIL and/or Section 106 is either reformed or replaced by IL.

These need to be mitigated and managed rather than compounded by policy actions across design and implementation stages.

Table 2

   Issue and/or Design Parameter
1 Simplicity, uniformity, and certainty at a national level versus flexibility of treatment and incidence at a local area and site level.
2 Securing revenue-generation sufficient to meet locally cumulative infrastructural requirements versus development viability, whether at an area or project basis.
3 The definition and assessment of development viability and its constituent parameters, including assumed developer profit and landowner premiums.
4 The related extent that national or even LPA-wide tariff-based systems and possible supplemental mayoral strategic infrastructure levies and other parallel mechanisms, notably site negotiable S106, can achieve increased public land value capture.
5 The funding and provision of lumpy infrastructure projects that become cumulatively ‘necessary’ at a point before sufficient resources from slowly uncertain accumulating revenue funding streams are realized to pay for them – the tipping point and cumulative funding problem – at least in the absence of centrally provided capital subsidy, delegated forward funding approval(s) or alternative new local funding sources.
6 Securing the co-operation and funding input of other public authorities (such as county councils with education powers or Network Rail) or agencies (such as the Highways Authority) that possess funding profiles and priorities often different from that of LPAs.
7 The ability and capacity of new school and improved transport connectivity provision not only to make a marginal new development acceptable in planning terms, but also to facilitate or to make possible future development – the ‘crowding-in’ funding effect central to strategic regeneration schemes, such Barking Riverside and Oxford and Cambridge Arc.
8 The receipt gestation and other transitional problems that any new scheme would involve and/or need to overcome.
9 The related prospect of having to operate legacy systems, including CIL and S106, in parallel with a prolonged introduction of a new mechanism.
10 The establishment of robust local processes that prioritise infrastructure needs and then match associated spending profiles to supporting funding streams or sources and that then effectively and transparently monitor resultant outcomes.
11 The resourcing and capacity of LPA planning departments to operate in an efficient and timely manner such schemes in accord with their purported objectives.

 This section began by noting that CIL was introduced as an alternative to a proposed mechanism, PGS: an explicit national tax on development value crystallised by planning permission.

Although CIL, unlike PGS, was designed to be voluntary and locally based, allowing some local flexibility in rate-setting and treatment, it still constituted – both in intention and effect – a local levy on development value: proceeds could be used to plug existing or to meet future deficiencies in local infrastructural provision not necessarily directly related to any chargeable development.

Its introduction reestablished the principle of taxing land value betterment, albeit this was only tacitly recognized by government at the time.

CIL was undermined by design and transitional problems leading to its patchy local implementation, crucially compounded by a continuing lack of overarching central government policy clarity and certainty.

Any steadfast national public policy commitment to securing increased infrastructural investment in line with local affordable housing requirements and economic development needs likewise was notable only by its absence.

Such an absence of overarching political commitment and drive will invariably undermine any replacement to CIL, namely the new IL, included in the Levelling-Up Bill expected to receive Royal Assent in 2023. To that, we now turn.

4          The emerging IL

The August 2020 the Planning for the Future  White Paper (PWP), announced an intention to replace the Community Infrastructure Levy (CIL) and the current system of planning obligations with a new nationally set, value-based flat rate charge: the Infrastructure Levy (IL).

The IL did not emerge into the PWP out of thin air. Its antecedents can be traced back decades to the often-official espousal of alternative tariff approaches to S106, some of which were discussed in previous sections, grounded on a perception that these could offer greater predictability and certainty and thus reduce delays and costs.

S106 obligations, in any case, could include tariff-like requirements set on a per dwelling basis. Barker herself in her 2004 report was receptive to such a treatment.

The PWP took on board the tentative long-term preference of the 2018 consultation (itself influenced by the 2017 CIL Team Review) for a nationally set and non-negotiable levy to replace CIL and S106.

In that light, it proposed that CIL and Section 106 should be consolidated into a nationally set, mandatory value-based flat rate Infrastructure Levy (IL), levied as a fixed proportion of the final development value of sites or schemes above a minimum threshold at the point of occupation.

The PWP expected the new IL to raise more revenue and to deliver at least as on-site affordable housing as the existing combined CIL and S106 developer contribution system did without the “months of negotiation of Section 106 agreements and the need to consider site viability”.

It would also deliver more of the infrastructure that existing and new communities required by “capturing a greater share of the uplift in land value that comes with development”.

Permitted development rights were to be included in the scope of IL, so that additional homes delivered through this route could provide funding support for new infrastructure.

LPAs could specify the forms and tenures of the on-site affordable provision required, working with a nominated affordable housing provider (Provider), who could purchase the dwellings at a market-discounted rate.

That discount (the difference between the price at which the unit was sold to the Provider and the market price) would then be considered and costed as an in-kind delivery component of the IL that would then be subtracted from the developer’s IL liability for that site, prefiguring the ‘Right to Require’ included in the March 2023 consultation, discussed below.

Few of the 44,000 respondents to the consultation that followed on to the PWP felt that the new proposed levy would in practice increase on-site delivery of affordable housing, however.

Most, including the Royal Town Planning Institute and Shelter, expected it instead to reduce such provision. A survey of social housing providers found that only four per cent of respondents believed that the PWP proposals would deliver more homes for social rent and help to deliver mixed communities.

Although linking IL liability to realised development values was welcomed by some commentators, many also pointed out that its corollary was that some infrastructure necessary for development completion would need to be forward financed by LPAs, subjecting them to both development and funding risk, echoing a criticism made by the 2017 Review of CIL.

The PWP had indicated that LPAs would be permitted to borrow against IL revenues to forward fund infrastructure, as well as be bound by a new nationally determined local housing requirement, which they would have to deliver through their Plans at a local level consistent with the stated government aspiration of “creating a housing market that is capable of delivering 300,000 homes annually, and one million homes over this Parliament”, focused on areas facing the highest affordability pressures.

But when in parallel to the August 2020 PWP consultation, the government proposed associated interim changes to the standard method of assessing local housing needs that would produce figures in aggregate more aligned to its 300,000 national target, following NIMBY opposition within and outside parliament during that autumn, they were withdrawn within three months.

Proposed changes to the NPPF, published in December 2022, according to assessments undertaken by Lichfields and Savills, will reduce future housebuilding levels to around half of the that target, to c155,000 or lower (not taking account of the impacts of any prolonged housing market downturn).

Legislative provision for the IL to replace CIL in England was made in Part Four of the Levelling-up and Regeneration Bill (LURB) introduced into the Commons in May 2022.

The policy paper that accompanied LURB described IL as a “simple, mandatory, and locally determined Infrastructure Levy”.

That shift to a locally determined rate represented a key departure from the PWP design, which, following previous consultations, proposed a nationally determined rate.

 As such, it reflected recognition that it was not possible to combine certainty linked to uniformity with the flexibility in rate-setting needed to both to maximise potential land value capture across high value areas and to maintain development viability across low value areas, given the greatly variant development and site circumstances that prevail across and within LPAs.

During LURB’s passage through the Commons, MPs expressed concerns that the indeterminacy and lack of design detail of IL risked future complexity and uncertainty – contrary to stated intention, as well as doubts as whether it would secure developer infrastructural and affordable housing contributions comparable to the current combined CIL and S106 system, let alone more.

In March 2023, DLUHC issued a technical consultation on the detailed design of IL, indicating that further consultation would follow when the necessary secondary regulations needed to enact it were published.

According to LURB (as amended) and the March technical consultation, IL will:

  1. Largely replace existing CIL and S106 contributions towards community infrastructure and affordable housing in England (not Wales), except for the London Mayoral Levy.
  2. Apply to all types of development including permitted development, except for defined exemptions.
  3. Be calculated and collected as a set percentage of the Gross Development Value’ (GDV) of completed and sold developments above a minimum threshold level (on a £ per m2 basis), below which it will not be charged, “broadly meaning that the Levy is charged on the increase in land value created by a development”. Provision for staged or interim payments may be made, subject to the government response to the March technical consultation and later regulatory development. Constituting, in effect, a tax on completed sales value of a development, rather than a set and then fixed percentage of the additional floorspace approved at point of planning permission, regardless of its future value, IL should, according to the government, allow “developers to price in the value of contributions into the value of the land, allow liabilities to respond to market conditions and removes the need for obligations to be renegotiated if the gross development value is lower than expected; while allowing local authorities to share in the uplift if gross development values are higher than anticipated”.
  4. Rates and minimum thresholds to be locally set that could vary according to sub-area or type of development, according to a typology of development typical to each individual LPA.
  5. Charging schedules must pay regard to development viability and will be subject to public consultation and Examination, subject to Secretary of State intervention. In that light, rates and minimum thresholds set across applicable site typologies should “balance the need to capture land value uplift with the need to ensure that development remains viable” and that landowners are sufficiently incentivised to release sites for development. 
  6. Be mandatory. Deadlines for its implementation at LPA level will be centrally prescribed, with the rider that each LPA will have at least 12 months to implement.
  7. Involve introduction of a new ‘Right to Require’ for LPAs, allowing them to determine a non-negotiable proportion of IL that they should receive as in-kind onsite affordable home contributions of value “at least as much onsite affordable housing” as does the existing system. The precise measurement of that benchmark, involving the quantification of value of the affordable housing so provided and the associated detailed operation of the ‘right-to-return’, will be subject to subject to the government response to the March consultation and later regulatory development.
  8. Require developers to deliver infrastructure defined as “integral” to the operation and physical design of a site – such as on-site play areas, site access and internal highway network or draining systems – through planning conditions. Where this is not possible, integral infrastructure will be delivered through targeted planning obligations known as ‘Delivery Agreements’. All other forms of infrastructure – ‘Levy funded’ infrastructure – mostly community infrastructure, will be collected in cash through a ‘Core Routeway’, save for the operation of the ‘Right to Require’. The dividing line between ‘Integral’ and ‘Levy-funded’ infrastructure will be set in subsequent regulations, policy, and guidance, informed by the March 2023 technical consultation process.
  9. Restrict S106 otherwise to an ‘Infrastructure In-Kind Routeway’ where “infrastructure will be able to be provided in-kind and negotiated, but with the guarantee that the value of what is agreed will be no less than will be paid through the Levy (using the Core Routeway). A ‘S106-only Routeway’, where IL will not be collected, will apply when GDV is not calculable or where buildings are not the focus of development, such as minerals or waste sites. LPAs to set out in their local Plans the routeway applicable to distinct kinds of site after future regulations set an overarching framework for IL to operate in, also subject to further consultation.
  10. Allow forward funding through borrowing and use of reserves by LPAs to finance local infrastructure, subject to further regulatory development.
  11. Be staggered in implementation to allow a ‘test and learn’ approach to be applied over several years, so “allowing for careful monitoring and evaluation, in order to design the most effective system possible”. The earliest expected time for ‘test and learn’ LPAs to introduce IL is expected late 2024-25 with operation beginning in 2025-26.
  12. Require LPAs to prepare and publish Infrastructure Delivery Strategies, setting out how they intend to spend IL income, with other infrastructure providers required to assist their preparation, subject also to Public Examination, and:
  13. Sites permitted before the introduction of IL in each LPA will continue to be subject to their CIL and section 106 requirements.
  14. It may be possible for LPAs to spend IL receipts on recurrent service provision, subject to future regulatory regulation.

As ever, and as reported above, much will depend upon future detail, including how securing ‘at least as much’ affordable housing will be measured – a metric that in size and tenure composition terms differs significantly between authorities and can change over time with changing local circumstances and needs.

The technical consultation suggested that the most appropriate measure may be the value of the average cumulative discounts of affordable housing secured over an extended period at a LPA level, to reflect differences and changes in type and wider market conditions secured over the period selected.

It further noted that across some high value areas, the total value of the in-kind affordable housing provided could exceed the total IL liability.

Likewise, the consultation recognised that where the threshold for the Infrastructure In-Kind Routeway is set – which could range from a 500 to 10,000 dwelling qualifying threshold – will have significant implications for the final design of IL. Another big problematic issue with an uncertain answer.

A lower threshold would allow greater scope for developers to deliver infrastructure as an in-kind contribution, while a higher threshold is likely to be associated with greater uncertainty and negotiation.

For instance, as to whether additional community infrastructure, such as a new school or GP surgery, was required to mitigate the direct impacts of – and thus were integral to – the site, or rather reflected wider cumulative impacts of population growth, and/or both.

The opportunity, problem, and risk profile

The primary potential advantage posited for the introduction of IL is that it possesses the potential to raise more revenue in a more certain way than can CIL.

First, it would be mandatory and have wider coverage than the combined discretionary S106 and CIL system.

Second, its calibration to a percentage of final development value rather than to a fixed percentage of additional development floorspace approved at point of planning permission, as is the case with CIL, allows for greater development upside – whether that results from wider market conditions, the commercial success of a particular development, or the innate profitability potential of some types of developments – to be captured for public purposes.

Back in May 2019, the Scottish Land Commission advised Scottish ministers that a financial modelling exercise it had conducted with the Scottish Futures Trust, comparing the emerging model of an Infrastructure Growth Contribution Levy (IGC) – then contemplated for possible introduction in Scotland – with the Community Infrastructure Levy already established in England, had concluded that IGC would offer a more effective tool for land value capture.

This was attributed to the IGC’s “non-linear formula” calibrated to development value and because it would apply to “most developments”.

IGC, it was envisaged, would continue to operate alongside S106 (S75 in Scotland) and unlike IL would be levied at point of planning permission, but has not been subsequently introduced.

Most recently and relevantly, modelling and case study evidence assembled by a research team highly experienced and expert in the area reported in an evaluative study (the 2023 study), commissioned by the DLUHC and published in February 2023, suggested that substantial scope existed for IL contributions to exceed total developer CIL plus S106 contributions in the case of greenfield residential developments located across LPAs with high housing values.

This modelling, across a range of LPA case examples, compared potential IL proceeds obtainable at an estimated lower bound – calibrated to the scale of total developer contributions expected from within the existing system from a policy compliant scheme – and an estimated upper bound defined “as the maximum rate at which IL could be set whilst maintaining benchmark land value (sufficient to incentivise the landowner to release) and a 15% internal rate of return (IRR) to the developer”.

Proceeds from levying IL on warehousing, purpose-built student accommodation, and some other types of development largely untouched by the current scheme, could also increase aggregate proceeds beyond existing levels.

Other potential advantages could include greater certainty as to the scope and coverage and quantum of developer contributions, thus reducing the need for negotiation.

The 2023 study went on to point out, however, supported by qualitative local authority interview evidence, that most of the potential advantages posited for IL, depend upon assumptions that tend to conflict with reality on the ground or it could introduce further complexities and problems, and/or replicate the problems encountered by CIL.

The core driver and justification of IL is to increase proceeds for infrastructural investment. But increased CIL rates and extended its coverage to include permitted development, commercial development, and reduced exemptions could do likewise.

The government, reprising the findings of the latest published August 2020 CIL review, itself recognised in its recent March 2023 technical consultation that, when charged, CIL increased developer contributions available for infrastructural provision.

60% of CIL charging authorities reported increases in land value capture following its introduction, while 38% of non-CIL charging authorities believed that it could enhance value capture.

An incidence shift to a value-based levy on final realised development value might offer the prospect of greater proceeds and upside for LPAs, especially during the rising period of national and local economic and housing cycles.

But equally, it could result in downside risk and could involve prolonged asymmetrical negotiation and scrutiny with uncertain outcomes – a problem and issue that was raised during the consultations concerned with PGS.

IL proceeds are still likely to be geographically concentrated in high value areas, while the truncation of S106 will tend to break the contractual link between scheme development and infrastructural provision that it can provide.

Achieving “a similar level of affordable contributions” based on past contributions is likely to prove problematic to measure.

Setting and measuring the benchmark in a way that reflects the messy reality of divergent past practice will prove complex and challenging and is likely to be mired in confusion and uncertainty.

Even if the past pattern of developer contributions was achieved in practice and they reflected current requirements, it would not represent a net system improvement, certainly when transitional and implementation costs are factored in, unless IL was also successful in generating additional overall proceeds that could then be used for local community infrastructural development.

That begs the question as to the overall point of such a complex and indeterminate exercise, if it is to simply measure whether the local operation of IL is likely to provide as much affordable housing contributions as before, even though that level – even if accurate – may not provide a good base to meet current and future housing need requirements, consequently requiring further negotiation at a local level to realign them in line with changing national and local policy and other conditions.

Some further problems are obvious and stark: the setting of charging schedules will not necessarily synchronise with local Plan-setting processes, and will not in the future, unless the local Plan-making process becomes much more streamlined and truncated. That seems simply wishful thinking rather than a credible assumption.

More likely is that the introduction of IL will further complicate the Plan-making process, providing more excuse and reason for delay at a local level, thus not only self-defeating much of the purported purpose and intention of IL, but further undermining the wider working of the planning system.

IL will also need to run in parallel with a legacy CIL and Section 106 system for many years, that is if it gets off the ground: precisely the same transitional problem that bedeviled CIL across its early years, engendering the associated confusion and uncertainty that made it a target of criticism and replacement of previous successive consultation cycles, as a range of stakeholder organisations underlined in a June 2023 letter to the Secretary of State.

The long and apparently damning inventory of problems and issues associated with S106 that section 1 documented have long been the butt of successive government consultations, but as that section pointed out, progressive improvements in S106 practice, attributable to the use of standard templates, learning by doing and from experience, and greater consistency and certainty in national and LPA policy and practice, has weakened the force of some of these criticisms.

Proposed replacements, including PGS, the use of standardised tariffs, LIT, and now IL, all recognised the need to retain S106 in some shape or form.

As section 3 discussed, and Table 2 identified, many of the problems connected with CIL were a product of political mismanagement related to a lack of overarching commitment to first order objectives, including increasing infrastructural investment closer to needed economic and social levels, and/or to design problems inherent to any land value capture mechanism that aims to combine the advantages of national policy certainty with needed local flexibility in implementation.

Increased levels of public investment and the setting of supportive arrangements for LPAs to forward finance necessary local infrastructure provision consistent with economic and housing supply outcomes, also stares into the jaws of the real fiscal crisis of the state:  unwillingness or inability of government or political parties seeking electoral majorities to tax or borrow sufficiently to provide resources to secure the outcomes expected and/or needed.

A related danger exists that allowing IL proceeds to be used to support recurrent revenue budgets that they become a substitute for central government revenue support and/or local tax sources or stockpiled rather than used to fund local cumulative infrastructural requirements.

Some of the authors of the government commissioned 2023 evaluation study of IL have questioned whether significant simplifications to S106 and CIL could achieve  similar goals with less damaging disruption and delay, for example, by: using a fixed tariff instead of CIL for smaller sites (say, up to 100 dwellings for residential and an equivalent for commercial) for affordable housing and site mitigation with no exemptions so better linking funding to requirements (retaining CIL only for Mayoral CIL (London and combined authorities) for sub-regional/regional infrastructure; retaining Section 106 for larger for more complex sites requiring discussions and negotiations  while using a partnership-type approach, as suggested by the Letwin Review, for very large sites,  and, more ambitiously and optimistically, ensuring that Local Plans are in place that clearly state infrastructure requirements.

5          What should happen in 2024

IL will not become operative until 2024 at the earliest when its initial introduction could coincide thereabouts with a general election that autumn.

A new government, if it secured a working majority would then be able to decide whether to proceed with IL, as the incoming Cameron government did in 2010 with CIL, whether combined with parallel or interim reforms to CIL and S106 and to what extent, or to shelve it altogether.

The core concern and conclusion of this website is that the upheaval, confusion, and policy blight that would follow the introduction of replacement IL proceeding fitfully in parallel with the existing CIL and S106 systems withering on the vine for a decade or more, is likely to result in more harm than good.

The lesson of the CIL implementation process was clear enough and should be learnt this time round.

The design and transitional problems that afflicted CIL, set out in section 3, were largely the result of policy uncertainty and fluctuation, a necessarily long gestation period combined with slow and patchy take up, all compounded crucially by a continuing lack of overarching central government policy commitment, all risk repeating with IL.

It simply seems astonishing that the government appears to believe that introducing another complicated reform attached with a long receipt gestation and learning curve period that will still need to run for many years in parallel with, the existing CIL and S106 legacy systems – running with three or more horses, in effect –  will prove a positive catalyst and support of local infrastructural and affordable housing supply, rather than either policy blight and upheaval or both for LPAs for much of the next decade or beyond.

The Laurel and Hardy song concerning the successive unsuccessful efforts of the comic but relatable duo, as removal men, to transport a grand piano down a tenement block staircase rather comes to mind:

“We were getting nowhere … so we decided to have another cup of tea” – paraphrased here to – “after many years of getting nowhere, we were finally getting somewhere, if not that different in destination from where we started from, but after another cup of tea (aka: policy review/initiative in this case) we decided to start again from the beginning and get nowhere again for a while”.

Unfair poetic license, perhaps, insofar that the process undertaken by DLUHC has served to highlight the potential for more land value on greenfield sites to be captured and has suggested a more systematic approach to the costing and the obtaining in kind affordable housing contributions.

That said, it must be expected that the net present value of the distant and uncertain benefits that IL might generate a long time in the future, if realistically discounted, will be low at best and more likely negative. And, of course, a decade on past form it will be time for another disruptive reform.

Putting in hand ‘working with the grain’ incremental reform to, rather than a complex replacement of, the existing ‘present imperfect’ CIL and S106 systems, focused on the issues identified in Table 2 seems to offer a more sensible way forward.

Such changes should include setting clear process arrangements for the forward financing public funding of infrastructure to help to ‘crowd-in’ future development, the definition and application of development viability with reference to land value mechanisms (whether IL, CIL or S106) that can best reconcile national certainty with needed local variation,  securing greater consistency of, and certainty in the application of S106 affordable housing contributions at both central and local levels in a way that could tap effectively into the potential for increased land value, where that was present.

There also could well be merit in introducing as a mandatory default a low level LIT for those LPAs lacking a CIL schedule.

As the previous section noted, CIL coverage could be widened and deepened. CAs or at least the Metro Mayors could be empowered to levy a SIT where they could demonstrate that its proceeds are needed to unlock locally economic enhancing development through pump priming specific infrastructural additionalities, such as new transport links and stations.

Allowing LPAs to retain higher proportions of locally levied business rates could facilitate local infrastructural provision assisted by prudential borrowing.

In that light, the second core conclusion of this website, is that any new government should address and progress the first order design issues that Table 1 set out that before committing to IL or any new scheme.

Ideally, some variant of IL could be piloted as a demonstration project alternative in Scotland, where CIL is not levied, but that depends upon the consent and support of the Scottish government.

Most fundamentally of all, any future reform to be successful requires the necessary overarching political and policy commitment to be present on a sustained basis. Without that, nothing is likely to succeed.

Share this:

  • Click to share on X (Opens in new window) X
  • Click to share on Facebook (Opens in new window) Facebook
  • Click to print (Opens in new window) Print
  • Click to email a link to a friend (Opens in new window) Email
  • Click to share on WhatsApp (Opens in new window) WhatsApp
  • Click to share on LinkedIn (Opens in new window) LinkedIn

Filed Under: Housing, Macro-economic policy Tagged With: CIL, Infrastructure Levy, planning

The 2020 Planning White Paper: Key Lessons

3rd June 2023 by newtjoh

Link

This extended post outlines the main proposals of the PWP before explaining why they were mainly stillborn, mainly because it had unrealistic aims not matched by demonstrable capacity or commitment to implement them – identified as a foundational weakness of modern UK politics, tending to become ever more entrenched.

It goes to explain how that weakness meant that when the NIMBY elephant in the room reared its head, the government not only backtracked but reversed policy direction, using some case examples to illustrate practice and issues at the local level and its interaction with national policy, and the resulting implications.

The concluding section looks towards 2025 beyond the next election to the prospects for housing and planning reform, suggesting that a 300,000 national target is over optimistic, a banner for political show, rather than a feasible, if challenging, policy objective, and that a more realistic 250,000 rising to 275,000 target that underpinned and correlated with supporting planning reform and increased land value capture and first order economic objectives might well offer faster and more effective progress, but only if seriously sought and supported by the necessary overarching central government policy priority, clarity, and certainty, which is a prerequisite for any progress.

1          Antecedents and summary of the PWP

Early in 2020, two Policy Exchange (PE) reports, Rethinking the planning-system for the 21st-century  and the more eclectic topic-based Planning Anew were published that emphasized the negative part that the planning system – especially across high housing demand areas – plays in reducing new housing supply, in pushing up prices, and in redistributing income and wealth from renters to homeowners.

The system’s discretionary, cumbersome, over-detailed, extended, and uncertain characteristics, including its use of mechanistic “largely unpredictable’ future projections of economic and housing need over a 15 year or more period inherently subject to uncertainty, required “‘wholesale change” allowing it to be freed from the continuing legacy of the 1947 Town and Country Planning Act, itself established to further a “command and control” economy.

The Building Better, Building Beautiful Commission Living with Beauty, also published a report, which offered two central conclusions.

In its eloquent own words, these were, first, “We do not see beauty as a cost, to be negotiated away once planning permission has been obtained. It is the benchmark that all new developments should meet. It includes everything that promotes a healthy and happy life, everything that makes a collection of buildings into a place, everything that turns anywhere into somewhere, and nowhere into home. So understood beauty should be an essential condition for the grant of planning permission”.

Then, second, “good quality housing development costs more to deliver. Whilst data is limited in this regard, anecdotal evidence across the projects studied suggests that the cost premium might range between 10% and 22%. Our analysis showed that this could be offset by the value premium, concluding that following a quality agenda is a viable choice. The choice to adopt a higher quality route need not preclude cheaper housing. Both may be equally profitable and both may sit comfortably alongside each other offering choice to consumers at different price point.”

All three reports influenced the August 2020  Planning for the Future  White Paper (PWP), which then prime minister, Boris Johnson, in his usual customary hyperbolic style, described, in its forward, as “radical reform unlike anything we have seen since the Second World War” to “tear down” the existing crumbling, cumbersome, and complex planning system.

The PWP then proceeded to set out its stall in more somber terms. It diagnosed the system’s core problem its reliance on a discretionary rather than a rules-based Local Plan process. Most planning consents – contrary to general European practice – were made on a case-by-case basis rather than by reference to clear set rules, causing up a third of consents to be subsequently overturned on appeal.

Another fundamental failing was it “simply does not lead to enough homes being built, especially in those places where the need for new homes is the highest”, pointing out that adopted Local Plans provided for 187,000 homes per year across England – far short of the government’s ambition of 300,000 new homes annually.

Such structural under supply made housing increasingly expensive, compared to European peers, such Italy, Germany, and the Netherlands, where “you can get twice as much housing space for your money compared to the UK”.

Consultation and participatory arrangements often crowded out or ignored the voices of the young and others, which, as they were the very people that depended upon new developments meeting their needs to proceed expeditiously, exacerbated entrenched inequalities.

The PWPs proposed cornerstone reform in response was a shift to a rules-based tri-zonal system of development control, comprising:

  • Growth areas suitable for substantial development; outline approval for development would be automatically granted if it was in conformity with the forms and types of development specified in the applicable Local Plan;
  • Renewal areas suitable for some development, such as gentle densification; and,
  • Protected areas where – as the name suggested – development would be restricted.

Local Planning Authorities (LPAs) in future were to complete the plan-making process within a newly required time limit of 30 months.

General development management policies would also be set nationally, obviating the time and resource costs involved in assembling a long list of local development “policies” of varying specificity.

Local Plans under this new regime would instead concentrate on site- and area-specific requirements and on local design codes. A core set of “visual and map-based” digitally based local requirements for development would be limited to “setting out site- or area-specific parameters and opportunities”.

Concerning housing delivery, a new nationally determined, binding housing requirement would be set for LPAs to deliver through their Local Plans, focused on areas where affordability pressure is highest, consistent with the government’s “aspirations of creating a housing market that is capable of delivering 300,000 homes annually”.

The PWP also signaled future measures to speed up build up delivery rates across large sites, to provide better information to local communities, to promote competition amongst developers, to assist SMEs and new entrants to the sector, as well as to improve the data held on contractual arrangements used to control land.

Another strong focus was on ‘beauty’, broadly defined as good design rooted in a local ‘sense of place’, reflecting a reaction against burgeoning ‘cereal box or ‘identikit’ drearily designed developments that had become almost a ubiquitous feature of the periphery landscape of ‘middle England’ market towns, amid deteriorating quality and space standards.

Highlighting the need to deliver more of the infrastructure existing and new communities require by capturing a greater share of the uplift in land value that comes with development, the PWP also announced an intention to replace the Community Infrastructure Levy (CIL) and the current system of planning obligations with a new nationally set, value-based flat rate charge: the Infrastructure Levy.

This would “raise more revenue than under the current system of developer contributions, and deliver at least as much – if not more – on-site affordable housing as at present” and “enable us to sweep away months of negotiation of Section 106 agreements and the need to consider site viability”, and will be considered separately in a succeeding dedicated post.

In general, the PWP was a curious and interesting mix of high-level free market, social democratic and communitarian principles, partly reflecting, perhaps, the divergent drivers of a post-fiscal austerity Boris Johnson government that needed Janus-like to accommodate both its disparate new “Red Wall’ and its traditional ‘middle England’ sources of electoral support.

It is difficult to dispute that the nine key criticisms the PWP made of the existing planning system possessed at least some validity nor that much of its vision was appealing, when less than 40% of English LPAs in early 2023 possessed an up-to-date Local Plan, spurring developers to make speculative applications or to make appeals against permission refusal, or when the long gestation period involved in their production can cause them to be already out-of-date when finally adopted.

Features not inconsistent with the PWP’s conclusion that the existing planning system was generally not fit for purpose; or, indeed, at its worst, when measured against its purported objectives, self-defeating.

2          Why the PWP was stillborn

The PWP was, itself, self-defeating, however.

Its ‘big bang’ upending of the system that it seemed to inherit from the Policy Exchange in preference to a more ‘make do and mend’ incremental approach was always going to be at the mercy of both national and local public government commitment and/or capacity.

But any grounds for optimism that local LPAs, following years of under-resourcing, could cope with introducing such a new system in the timescales set was whimsical or flimsy, at best.

Even more crucially, the lack of an accompanying national robust evidence-based, funding and policy framework to the PWP indicated unrealistic aims not matched by demonstrable capacity or commitment to implement them.

A not unusual feature of modern UK government and politics, it must be said – a foundational weakness tending to become ever more entrenched.

That weakness was soon to be exposed, with the PWP likely to prove a prime case example.

Unless overcome, such foundational weakness will almost certainly render ineffective any successor attempts at reform in the face of the political and institutional challenges and conflicting objectives that any future reform would have to both balance and surmount.

Trampled by the NIMBY elephant in the room or a flawed method or both

The PWP failed to adequately address the political reality (partly picked up in its own diagnosis) that low turnout in local elections combined with the disproportionate tendency for older homeowners – as well as with their growing share of the general population – to participate in them, is a systemic barrier against development proceeding at a level anywhere close or consistent with the achievement of the government’s overarching 300,000 annual new supply target.

On the ground, local councillors generally face greater pressure from often vocal and well organized existing and established resident groups to refuse permissions to build local extensions to settlements and/or high-density urban developments, under the banner of protecting the ‘character’ of their area and/or avoid adding to local infrastructural shortfalls, than they do to step up local housebuilding.

Such new development could or should in the future help local young people needing access to affordable accommodation or in-migrants that are seeking to work in growing sectors of the economy, such as IT and biotechnology – often located in high values areas, including the Oxford and Cambridge Arc.

But as the future benefits of such developments are dispersed and delayed, their potential future beneficiaries are, unsurprisingly, far less likely coalescence into a local organized grouping and/or to participate in development specific consultations than are existing residents agitating against proposed specific local developments in real time, the disbenefits of which are concentrated within their communities.

To suppose that better designed proposed developments, even with higher proportions of affordable housing, will necessarily placate such local opposition was always going to be optimistic: established residents enjoying a high-quality local environment often oppose new development because it threatens the ‘character’ of their area, spoiling their views and their peace and quiet.

This is even when such proposed developments will lie beyond their neighbourhoods or are close to transport modes (in the case of existing high density urban areas) or are on greenfield sites on the periphery of their home settlement boundary.

Relatively affluent residents seldom welcome new social housing or other developments that might mitigate against house price appreciation or impact upon school catchment areas: self-interest rather than altruism tends to prevail.

That NIMBY elephant in the room was always going to translate into local political reluctance or refusal to designate the proposed growth or even renewal areas.

When it reared its head at Westminster to protest the prospect of increased centrally set local housing targets, much of the integrated vision of the PWP began to fall apart at unseemly speed, even before it was translated into legislation.

Concurrent with a wider consultation on the PWP, proposed changes to the local needs assessment algorithm or formula or the standard method for assessing local housing need (standard method)), “to make assessing the minimum number of homes needed in an area easier, cheaper and more transparent”, were also, in August 2020, put out to consultation.

The standard method was first implemented in the 2018 iteration of National Planning Policy Framework (NPPF) to produce the objectively assessed housing need (OAN) figure for each LPA, providing a starting point for its housing provision policies and its setting of local housing requirements.

The underlying formula starts with the projected average annual household growth over a consecutive ten-year period starting with the current year, using Office of National Statistics (ONS) 2014-based household projection base data.

This annual growth figure (baseline figure) is then adjusted according to the local ‘affordability ratio’ based on the latest ONS data on local authority median affordability ratios (local median house price divided by gross annual workplace earnings).

If the median house price is more than four times the average earnings of someone who works in the area, the average household growth baseline figure is revised upwards according to an adjustment factor.

Any resulting increase is subject to a 40per cent cap above the average annual housing requirement figure set out in the existing policies when adopted within the last five years and for LPAs with strategic plans more than five years old, 40per cent of whichever was higher of the projected baseline household growth figure, or the most recent number taken from the LPAs spatial development strategy.

The proposed revisions to that 2019 standard model, which included the complete elimination of the cap, were designed to ensure “that the new standard method delivers a number nationally that is consistent with the commitment to plan for the delivery of 300,000 new homes a year, a focus on achieving a more appropriate distribution of homes, and on targeting more homes into areas where there are affordability challenges”.

It was envisaged that they would then become part of the future process for setting any binding housing requirement, to be determined separately.

Using currently available data, the revisions generated a national housing need of 337,000 (in England): a figure, which, the consultation advised, would constitute the “starting point for planning and not the final housing requirement”, with the surplus reflecting that not all homes planned for are built, as well as to allow for a land buffer to compensate for the drop-off rate between permissions and completions.

The consultation went on to recognise that the revised method at a local authority level would affect individual authorities differently, with 141 authorities (excluding London boroughs) facing an increased requirement of a quarter or more over and their current plans or existing standard method numbers.

Many of these authorities were located across Conservative southern heartlands, while the revised method generally generated lower housing numbers in city authorities in the Midlands and North, often Labour controlled.

Regardless of whether the revised figures constituted a ‘target’ or a ‘minimum’ or something else (for the record, the consultation made it quite clear that “the standard method identifies the minimum number of homes that a local authority should plan for in an area”), that LPA performance and progress towards reaching such higher figures could be taken into account as material planning consideration by the Planning Inspectorate (PI) when determining developer appeals against consent refusals, soon induced intense opposition to the change within the ranks of Conservative MP’s and council figures, especially those representing ‘Middle England’ metropolitan suburban and shire county constituencies.

In the autumn of 2020, a 8 October Commons debate on a successful motion calling for the government to delay any planned implementation of the changes to the standard method for assessing local housing need, articulated many of the concerns and issues raised.

Theresa May, speaking as the MP for Maidenhead, advised that her borough’s housing target would increase by 21%, so strengthening the implication that its green belt would need to be built on.

She went on to add that despite her neighbouring Council, Wokingham Borough Council, delivering new homes over and above its target during the previous three years, under the revised method, its current annual target of 789 homes would double to over 1,635 homes.

Philip Hollobone, MP for Kettering, also advised the chamber that North Northamptonshire’s target would increase from 1,837 a year to 3,009 a year, when “since 2011 on average we have only managed to build 1,640 a year and at the very height of the market the maximum that was achieved was 2,100, the target is completely unrealistic and undeliverable”.

MPs of all parties cautioned against ‘over development’ across London and south-east or in the words of one “making Kent a patio”, at the risk of undermining the Levelling-Up agenda.

Many suggested that instead of relying on unattainable ‘top-down targets’ that failed to take account of local circumstances and preferences, forcing developers sitting on planning permissions to build out quicker and/or providing more affordable housing would prove more effective in increasing supply.

Jeremy Hunt, the MP for South-West Surrey, and the current chancellor, for example, after expressing concern about the threat to his constituency that a 20% higher housing target posed to ‘its beautiful countryside’, pointed out that the average income in his constituency was £39,000 when the average house price was £447,000,  requiring a first time purchaser to have a £60,000 income to afford an entry-level house, way out of the reach of a nurse, a police officer or a teacher.

He concluded that the proposed revised method would make that problem worse, not better, as “ simply increasing the housing targets does not help them, because the price of new stock is set by the price of existing stock, and all that happens is land banking, which is why in my constituency currently, only 28% of all the housing permissions granted are actually being built out”, while emphasising the need to ‘carry people’ in favour of local development.

Later that month, John Halsall, Conservative leader of Wokingham Borough Council graphically complained in an interview with Planning magazine that if the revised method goes ahead, “we’re really utterly stuffed. Not in a million years could we get a five-year supply. We’re just an open goal for any developer to score in ….I doubt there’d be a Tory council left in the South East afterwards. The government is well aware of the extent of the opposition now.”

Indeed, it was. A U-turn soon followed.

In its response to the consultation published in December  2020, the government announced, barely over three months after its proposed revisions went out to consultation that the standard method would be retained.

This was, however, attached with a big cavil: a 35 per cent uplift would be applied to the cap generated by the standard method to Greater London and to LPAs covering 19 most populated cities and urban centres in England: Birmingham, Liverpool, Bristol, Manchester, Sheffield, Leeds, Leicester, Coventry, Bradford, Nottingham, Kingston upon Hull, Newcastle upon Tyne, Stoke-on-Trent, Southampton, Plymouth, Derby, Reading, Wolverhampton, and Brighton and Hove.

In an accompanying ministerial statement, then Secretary of State for Levelling Up, Housing, and Communities (the Housing Secretary) Robert Jenrick, said the government had “heard clearly” that the building of homes should not be at the expense of “precious green spaces” and that instead it would be done better in urban areas.

This was despite evidence showing that there was and is not enough brownfield land to meet housing needs in any region, especially so in London and across other areas where demand and need is strongest.

It had taken less than four months, therefore, for the PWP’s radical ambition to wilt into political expediency.

The May 2021 Queens Speech, nevertheless, did, still go on to promise “laws to modernise the planning system, so that more homes can be built, will be brought forward”.

The concurrent wider consultation on the PWP had induced 44,000 responses, mainly negative, focused on concerns on its lack of detail on how the zonal system would work or how necessary associated infrastructural works would be funded, including that it would become a ‘developer’s charter’ that would increase the market value of land located in designated growth areas at the expense of affordable housing levels and of local community accountability.

In that vein, the Housing, Communities and Local Government Select Committee in June 2021 published a report  that noting the lack of detail or supporting evidence provided in the PWP recommended the government should reconsider its proposal to move to a zonal-based system with different planning rules applying depending upon zone.

It also disagreed with shifting public engagement from individual planning applications to the Local Plan stage, insofar that “far more people engage with individual planning proposals”, expressing concern and that proposed change risked reducing public involvement in the planning process.

That same month, the Conservative loss of the Chesham and Amersham by-election concentrated government minds even further on the real political downside risk of pressing ahead with planning reforms designed to help secure a higher housebuilding target as, inter alia, a means of expanding the numbers of new homeowners expected to imbue Conservative values in tune with their new tenure status.

Instead, it was perceived that pressing ahead with planning reforms could induce a loss of seats to the Liberal Democrats and/or encourage Labour and the Liberal Democrats to cooperate to make inroads into the ‘Blue Wall’ of supposedly safe Conservative seats, many of which were around London and other high value areas.

Given that watershed political moment, there was little surprise, therefore, when the new Housing secretary, Michael Gove, briefed MPs in March 2022 that in place of a standalone Planning Bill designed to replace and transform the existing post-1947 planning, a slimmed-down version of the PWP would be delivered as part of the Levelling Up legislation that he would pilot through the Commons during 2022.

The subsequent Levelling Up and Regeneration Bill (LURB) omitted the PWP’s flagship proposed shift to zonal planning and a system shift to rules-based rather than discretionary planning decision-making.

It did include, however, some significant PWP proposals, namely, requiring LPAs to start work on new Plans at the latest five years after adoption of their previous Plan, and then to adopt their new Plan within 30 months; and the production of centrally defined National Development Management policies that would have precedence in the case of any conflict with Local Plan policies.

Then that autumn, in November 2022, a large number of Conservative MPs signed an amendment to LURB, put forward by Chipping Barnet  Conservative MP Theresa Villiers, supported by Bob Seely MP for the Isle of Wight (who had initiated the 8 October debate two years previously) to make “centrally set” housebuilding targets “advisory and not mandatory” that “should not be taken into account when determining planning applications”.

Villiers, a longstanding advocate of not building high rise blocks on suburban sites and of protecting Green Belt and other greenfield sites, earlier that year was instrumental in getting the Transport Secretary to block on a legal technicality an application, by Transport of London (TfL) to build 351 flats, of which 40% by habitable room would have been affordable, on a car park TfL owned adjacent to Cockfosters Underground Station, given outline or ‘in principle’ approval by Enfield Council (ref: 21/025/FI/FUL).

The Labour controlled Enfield Council and the Greater London Assembly (GLA) concluded that the scheme, even though it involved tall buildings not in an area designated by the existing Plan for them, would result in ‘less than substantial harm’ to the setting of the Grade II listed Cockfosters Underground Station and to the adjacent Grade II registered Trent Park and Trent Park Conservation Areas, while its public benefits in terms of public realm improvements and the provision of affordable housing outweighed identified harms.

Villiers campaigned against the development because it would involve building four blocks from five to 14 stories in height, “out of scale and character with the surrounding area”, and result in an associated reduction of ‘park and ride’ car parking spaces from 336 to less than 50, replicating concerns she also had about a similar application for High Barnet Underground station, this time in her constituency.

Although the development offered, by unit, 39per cent low-cost rent – 11per cent London Affordable Rent (social rent) and 27per cent London Living Rent – with the remaining 61% to be let at between 60 and 70per open market rents, this was less than the Mayor of London 50per cent affordable housing target on public land despite public grant input. Some objectors doubted that overall the majority of development would be affordable to local keyworkers.

Villiers and other signatories to the Commons motion emphasized that they were not ‘against new housebuilding’, only that it should not be imposed in excessive density on inappropriate sites in such a way that would change the character of a local area and/or threaten Green Belt or other green open space land.

In a December 2022 Ministerial Statement the Housing Secretary, Michael Gove, to all intents and purposes, accepted or caved into that position.

Under the Community Control heading, he stated:

“I will retain a method for calculating local housing need figures, but consult on changes. I do believe that the plan-making process for housing has to start with a number. This number should, however, be an advisory starting point, a guide that is not mandatory. It will be up to local authorities, working with their communities, to determine how many homes can actually be built, taking into account what should be protected in each area – be that our precious Green Belt or national parks, the character or an area, or heritage assets. It will also be up to them to increase the proportion of affordable housing if they wish”.

My changes will instruct the Planning Inspectorate that they should no longer override sensible local decision making, which is sensitive to and reflects local constraints and concerns. Overall this amounts to a rebalancing of the relationship between local councils and the Planning Inspectorate, and will give local communities a greater say in what is built in their neighbourhood”.

The accompanying changes to the NPPF included:

  • weakening the presumption towards sustainable development “where meeting (housing) need in full would mean building at densities significantly out of character with the existing area”;
  • removing the requirement for LPAs to review local Green Belts, “even if meeting local housing need would be impossible without such a review”;
  • ending the obligation on LPAs to maintain a rolling five-year supply of land for housing where their Local Plans are up-to-date, and, in all cases, the requirement for the maintenance of up to an additional 20% buffer over and above that level;
  • The presumption in favour of sustainable development operative where delivery falls below 75% of a local planning authority’s housing requirement over the previous three years will be ‘switched off’ by an additional ‘permissions-based’ test where sufficient permissions have been granted for homes more than 115% of the authority’s housing requirement over the applicable Housing Delivery Test monitoring period.
  • Where authorities are well-advanced in producing a new plan, transitional arrangements over two years would allow them to show a rolling four year instead of a five-year supply of land consistent with the delivery of local housing requirements;
  • LPAs can take account of past over delivery of housing when setting or reviewing local housing targets;
  • increase community protections afforded by a neighbourhood plan against developer appeals – the relevant amendment to the NPPF, in effect, lifts the para 14 presumption in favour of development within an area where a neighbourhood plan (NP) has been adopted for five years or less, regardless of its LPA’s wider land supply and housing delivery position, as long as the NP also contains policies and allocations to meet its identified housing requirement;

The proposed NPPF confirmed that the broader ambition of the PWP had been sacrificed on the altar of Nimbyism.

The government had even regressed from the position that had prevailed prior to the publication of the PWP, undermining the operation of the existing standard method, which, as it had itself highlighted, resulted in figures that even if they had been achieved in total would still undershoot its overarching annual 300,000 new supply target.

According to assessments undertaken by Lichfields and Savills, the proposed revisions to the NPPF will reduce future housebuilding levels to around half of the that target, to c155,000 or lower (not taking account of the impacts of any prolonged housing market downturn).

Mechanisms of central government compulsion over LPA’s reluctant or even recalcitrant to plan for and facilitate increased local housing supply accordingly were watered-down and then reversed in face of local Nimbyism, in apparent fear of its perceived central and local electoral significance.

A sizeable minority of Conservative MP’s, including Simon Clark, Secretary of State for Levelling Up, Housing and Communities from September to October 2022 during the brief Truss administration and MP for Middlesbrough, lobbied against the changes, making the point that they would lead to less housebuilding retarding future the prospects for economic growth and the interests of the young and others needing new development for their economic and social future.

Liz Truss, however, despite railing against the ‘anti-growth’ coalition during the Conservative leadership contest that preceded her elevation to the premiership, had promised to dismantle ‘Stalinist top-down’ centrally set housing targets, in the process rather neatly encapsulating the conflict between prioritising higher growth and housebuilding and assuaging the populist NIMBY concerns especially pronounced within party and conservative voting electorates, between ‘blue’ and ‘red’ wall current and future sources of any Conservative parliamentary majority, and between retaining the vote of elderly owners and winning the future support of the aspiring young and middle-aged cohorts, many of which have been and face being priced out of home ownership.

Short-term political tactical considerations in the event overrode any semblance of strategy, although by the same token, the proposed revisions to the standard measure were themselves badly scoped and thought-out and politically cack-handed in implementation insofar they clearly not underpinned by careful modelling of the results and consideration of or preparation for their immediate political impact that they would foreseeably generate.

That tactical failure itself was related to the fundamental foundational weakness of the PWP as a strategic political project provided with unrealistic aims not matched by demonstrable capacity or commitment to implement them.

3          Nimbyism and planning policy and practice at the coalface

Another unintended but significant consequence of the PWP – again opposite to its declared intention – was that many LPAs delayed producing or updating their Local Plans. Although this was ostensibly to wait until the shape of the new system became clearer, for some LPAs the associated uncertainty provided a convenient reason or excuse not to zone or identify more land for housing: something they didn’t really want to do in any case.

Wealden Council

Take Wealden District Council (WDC) in East Sussex, a largely rural district. More than half of its land space is designated within the High Weald Area of Outstanding Natural Beauty (HWAONB) along with other important Sites of Special Scientific Interest (SSSI), Local Nature Reserves and Ancient Woodland, which constrains future development.

Yet it is also an area of high housing need and worsening housing affordability: the 2021 median Wealden house price was 13.76 times median local earnings, higher than then southeast regional average (10.74) and across England and Wales (8.92).

Its elderly over-65 population in 2019 accounted for 26 per cent of the overall population, compared to 19.5per cent regionally and 18.4per cent nationally with the total number of people aged 65 and over is projected to increase by 56per cent over 20-year 2019-2039 period.

WDC paused its Local Plan consultation in 2022 citing the policy uncertainty surrounding the PWP. It then further delayed the process to respond to the December 2022 consultation on the proposed revisions to the NPPF and other planning issues connected to the Levelling-Up agenda discussed in the previous section discussed.

That response  (WDC response) noted that while its current Local Plan, Provision of Homes and Jobs 2006-2027, adopted in February 2013, anticipated the delivery of 9,440 dwellings between 2006-2027 or 450 dwellings per annum (dpa), its objectively assessed housing need (OAN) figure when assessed under the standard method introduced in 2018 subsequently rose to 1,212 dpa (or 24,240 new homes in total over a 20-year period)

It argued that this large disparity between the adopted housing requirement and current local housing needs was too large for WDC to close in the absence of a new Plan provided with new sites.

In that light, the WDC response went on to largely endorse the government’s changes to the NPPF and LURB Bill, but with significant cavils.

Most notably, it asked the government to go further and remove altogether the five-year deliverable housing land supply (5YHLS) measure that since 2018 has been calibrated to the standard housing need measure, for LPAs (including those without an up-to-date local plan, such as WDC).

This was because the application of both the 5YHLS and the Housing Delivery Test (HDT) measurement “has and will continue to create confusion for the wider public, particularly where local planning authorities ‘pass’ one measurement, but ‘fails’ the other”.

Instead, the HDT, coupled with the proposed ‘additional permissions-based’ test included in the revised NPPF that would ‘switch off’ the application of the presumption in favour of sustainable development where an authority can demonstrate sufficient permissions to meet its housing requirement, should be used as the primary metric.

This would “support a plan-led system, by preventing LPAs who are granting sufficient permissions for new homes from being exposed to speculative housing development”.

The Council’s consultation response also contained much relevant commentary on emerging planning policy.

It advised that very few of our neighbourhood planning groups preparing neighbourhood plans in Wealden District are looking to allocate housing sites, perhaps, in part because of a perceived negative reaction from parishioners at the referendum stage if they did, but also because of the amount of work involved in assessing and allocating sites for only two years of protection from further speculative housing development, and, accordingly, it agreed with the proposal to extend that period to five years.

WDC does not include any Green Belt land, and its response expressed concern the proposed change in the review of Green Belt boundaries would result in LPA’s submitting local plans with potentially significantly lower housing numbers that could consequently result in their neighbours facing additional pressures to meet an increased amount of unmet housing need, even though many of which already face significant challenges in meeting their own identified housing need for other reasons (such as national landscape and ecological constraints).

Highlighting that that considerable areas around cities in the north are surrounded by Green Belt (Manchester, Liverpool, Sheffield, and Leeds, for example) the response questioned whether development supporting the policy programme set out in the Government’s Levelling-Up agenda can be realised given that there may be limited opportunity for the required 35per uplift in their housing need figures of the 20 most populous urban areas, which was supported as making “the optimal use of brownfield land, in sustainable locations, to meet national housing need”, to be realised.

In that light, the response went on to note Wealden District is overlapped by five housing market areas, including the urban areas of Eastbourne and Royal Tunbridge Wells, which  abut Wealden District to the south and north respectively, and that whilst neither of these neighbouring local planning authorities feature in the top 20 most populated cities and urban areas, WDC District faces similar issues in the respect of potential unmet housing need from its neighbouring urban authorities.

A need for further ‘guidance’ was recorded on how it can develop its ‘alignment policy’ (replacing the Duty to Co-operate that will be repealed when LURB is enacted) with its neighbours.

WDC as of 1st April 2022 had almost 7,700 (net) dwellings either provided with detailed planning permission, outline planning permission, or with a resolution to approve planning permission.

Although the response recognised that some of the larger sites cannot be completed within a five-year period, it argued that all new sites for housing should be commenced within a short period of time upon the granting of a detailed planning permission and the discharge of pre-commencement conditions. WDC had sought shorter time limit conditions (rather than the traditional 3-year period) for the commencement of those schemes to incentivise those developers to build out quickly.

Instructionally, WDC suffered two planning appeal defeats in 2022, which the council withdrew from following legal advice that it would be “defending the indefensible”.

The first appeal involved 200 homes on land west of Station Road in Hailsham  (planning reference WD/2020/2509/MAO), and the second, a mixed use development comprising 700 new homes, a new school and community facilities at  Mornings Mill Farm, Eastbourne Road, Lower Willingdon (planning reference WD/2021/0174/MEA).

Hailsham, a market town of 23,000 residents, is the largest Wealden urban settlement, while the Mornings Mill Farm site is located between Polegate (largely a commuter and local transport hub settlement, itself located between Hailsham and Eastbourne) and Lower Willingdon, essentially now an outer suburb of Eastbourne, but lying within WDC.

In both cases planning committee members went against planning officers’ advice, invoking ‘saved’ 1998 LP policies that were out-of-date and highways and environmental objections that the respective inspectors later confirmed were baseless, causing them to award costs against WDC of £440,000 due to the unnecessary delays occasioned as to what they defined as WDC’s unreasonable behaviour.

Because WDC could only demonstrate a 5YHLS of 3.66 years, because its Local Plan was out of date, and because of the scale of its unmet housing need, the planning inspectors granted outline planning permission, even though the two applications in question involved greenfield sites beyond – at least in part (the majority of the Morning Mill Farm site lies inside – the indicative “strategic development areas (SDAs)” set out in the council’s 2013 Core Strategy Local Plan (CLSP), which recognised that the 1998 development boundaries set in the existing adopted Local Plan would have to be breached to deliver necessary growth that the CSLP assessed is required to 2027, while the out-of-date 1998 Plan was based development required up until 2004.

Both outline approvals require 35per cent affordable housing. It was, in one of the schemes, capped at that level at the instigation of the council, to allow CIL contributions towards local infrastructural enhancements to be generated by 65% rather than a lower level of market housing.

These two cases clearly show a preference for the then Council to restrict development in locations that, according to the relevant inspectors, were ‘in principle’ suitable and sustainable and which were needed given WDC’s wider housing supply requirements.

An application for 300 new homes on the settlement edge of Hailsham at Old Marshfoot Farm (ref: WD/2017/0458MAO) had secured outline planning permission in 2018 against some strong local resident opposition. Local councillors had subsequently expressed regret about their decision in face of continuing resident opposition and were advised by officers that they could not revisit it. That memory may have played a part in the subsequent planning history of the above two cases.

Prior to the May 2023 local council elections, WDC had indicated an intention to publish its new Plan for consultation in late summer/early autumn 2023 to include new proposed site allocations and development management policies.

That revised timetable was itself made subject, however, to the highly qualified rider “to the actual timing of the NPPF updates and extent of the final changes and so remains uncertain”. As the Council, following those elections, then passed from Conservative control to no overall control, added uncertainty and probable further and extended delay can be expected.

Windsor and Maidenhead

Windsor & Maidenhead Borough Council adopted its Local Plan (2013-33) in 2022, nine years after its inception, and four years from when it was first submitted for Examination to the Planning Inspectorate. Its predecessor had been adopted in 2009.

This 2013-33 Plan set a 712dpa/ 14,240 dwelling requirement over the twenty-year plan period and made associated provision for some “moderate Green Belt release” to allow that full Objectively Assessed Need (OAN) figure for housing and identified employment needs to be met.

The Planning Inspectorate Examination report, in that light, had noted: “Essentially, the scale and type of housing and employment needed in the Borough cannot be met on non-Green Belt sites. Whilst the need for such development is not unique to Windsor & Maidenhead, the socio-economic effects of not providing it, taken together with the inability to accommodate it elsewhere, do amount to the exceptional circumstances necessary at the strategic level to justify altering the established Green Belt boundaries through the Local Plan, (para 101)”.

However, in February 2023, barely a year after the Council adopted its new Plan, its leader wrote to the Department of Levelling Up, Communities and Housing (DLUHC) to request flexibility in meeting the total OAN figure the remaining plan period, insofar that the Council was “paying the price” for adopting its new Plan in February 2002 abiding by government instructions at the time, when otherwise it would have “paused the examination process, like other local authorities have done, until greater clarity was given”.

Indeed, following Gove’s December 2022 ministerial statement, during a period covering less than four months, another 26 LPAs paused their Plan preparation. All except a handful specifically cited the continuing uncertainty on future local housing numbers they will be required to deliver and the associated impact on their five-year land supply and utilization of brownfield and/or greenfield land positions.

Figure One shows that by the end of March 2023, over 55 LPAs had delayed or stayed the progression of their Local Plan because of PWP policy uncertainty. They were mainly concentrated in high value/cost areas around London and adjacent counties most in need of additional affordable housing.

Balancing beautiful design and conservation with needed development

Whilst he was undermining the practical and realistic progression of the government’s purported overarching annual 300,000 new supply objective/target, Michael Gove in his capacity as Housing Secretary had continued to uphold the canon of beauty and good design, telling the Centre of Policy Studies at a November 2022 seminar: “We will see the wide adoption of design codes. We will use all the powers we have to make sure that developments which are not aesthetically of high quality don’t go ahead”.

The former co-chair of the  Building Better, Building Beautiful Commission was had already been appointed to head up the creation of a new government design body, the Office of Place, with a remit to roll out and evaluate the National Model Design Code (NMDC) – a toolkit to enable every council and community to create their own local design requirements and codes in accordance with the PWP’s vision.

Changes incorporated into the updated July 2021 iteration of the  national planning policy framework (NPPF) and its proposed December 2022 successor underscore that LPAs should ensure that new developments support “beauty and placemaking”, primarily through the preparation and use of local design codes in line with the emerging National Model Design Code.

The Wealden consultation response had complained that the proposed December 2022 NPPF emphasised the importance of beauty, but that the suggested means of assessment (the National Design Guide and National Model Design Code) did not provide a means to do that.

‘Beauty’ is subject to subjectivity and can vary with the beholder, and perceptions can change over time. That said, the definition and importance accorded to good design defined in relation to spatial context and circumstance clearly constitutes an important albeit contestable dimension of sustainability, as demonstrated in a recent case, involving SofS decision discretion.

In April 2023 the SofS decided (taken on his behalf by the relevant Minister, Rachel Mclean) to refuse planning permission for the Turnden, Hartley Road, Cranbrook  (Turnden) development.

The application involved the construction of 165 new dwellings (ref. 20/00815/FULL) within the High Weald Area of Outstanding Beauty (HWANOB).

The application had previously been approved by Tunbridge Wells Borough Council (TWB) and, following a public inquiry convened after the SofS called-in the scheme for decision, the appointed planning inspector had recommended full planning permission approval be granted.

This was because additional to the provision of 40per cent affordable housing (34 rented and 34 shared ownership), the scheme offered a “package of exceptional benefits”, including a biodiversity net gain of 21 per cent, landscape, and recreational enhancements, which, overall, “added up” to the ‘exceptional circumstances’ that under the NPPF is required to justify a development in an AONB.

The existing Local Plan of TWB was adopted in 2009 and it has been unable to demonstrate a 5YHLS for over six years. The proposed replacement Local Plan 2020-2038 (the eLP) is currently subject to Examination.

The entire Turnden site, which includes the Phase One 36 dwelling Turnden Farmstead (reference 18/02571) development separately approved and now close to completion, was allocated under draft policy AL/CRS4 for residential development and significant green infrastructure as part of the eLP.

Permission was granted February 2020 for the construction of up to 180 dwellings on the land at Brick Kiln Farm immediately north (LPA Reference 16/502860). This will subsequently extend the settlement boundary of Cranbrook up to the boundary of the application site. In addition to this, the approval of

Over the 2020-2038 eLP plan period, TWB’s housing requirement is 12,204 (678 dwellings per annum), more than double the previous 300 per annum figure.

The annual affordable housing component of that is 391 compared to delivery of an average c82.

Based on its current policy affordable housing threshold of 35per cent, TWB would require annual net total supply to increase to c1000 dwellings.

The inspector confirmed that as TWB cannot currently show a five-year housing land supply, paragraph 11(d) of the NPPF indicated that planning permission for Turnden should be granted unless: (i) the application of policies in the Framework that protect areas or assets of particular importance (in this case the HWANOB) provides a clear reason for refusing it; or (ii) any adverse impacts of it being granted permission significantly and demonstrably outweigh the benefits, when assessed against policies in the NPPF taken as a whole.

He concluded “that it is not an overstatement to say that it is rare for a scheme to deliver such a package of exceptional benefits, on a site located adjacent to a second tier settlement, delivering much needed housing, including affordable housing above the rate required by the development plan, in a highly constrained area, and which delivers landscape enhancements with limited associated harm, as well as biodiversity enhancements, while developing only a small proportion of the overall site and in doing so provides a strong long term settlement edge. …. (para838) given the limited extent of harm including to the HWAONB, in the context of the area’s particular housing needs and constraints alongside the wider substantial benefits that would be delivered, exceptional circumstances exist to justify the proposed development and it would be in the public interest. In the current circumstances, therefore, the combined adverse impacts would not significantly and demonstrably outweigh the benefits, when assessed against the policies in the Framework taken as a whole”.

His recommendation, however, was overturned by the SoS, mainly because the scheme design was not accessed as of a high standard reached through thoughtful regard to its setting and layout, rather “being of a generic suburban nature which does not reproduce the constituent elements of local settlements”, leading to a conclusion that its design rather than being a benefit of the scheme, as suggested by the inspector, was a neutral factor.

Overall, although the combined weight of the benefits was “substantial” they failed to constitute “a package of exceptional benefits”, while the borough’s current five-year land supply shortfall was “slight”.

The applicant, Berkeley Homes, in the wake of that refusal announced its intention to seek judicial review of the SofS decision that then was self-voided in May 2023 due to an inaccurate five-year land supply figure which was cited in the SofS’s Decision letter. Future developments are accordingly awaited.

The case examples illustrate some key realities that impinge on the planning coalface.

These include:

  1. Translating a national aspirational 300,000 new home target to a minimum local figure through the operation of a mechanistic formula subject to contestable assumptions was always likely to lead to local opposition.
  2. Insofar that the above target cannot be met by concentrating development and densification on brownfield sites within England’s twenty most populous urban areas, the achievement of such a national target will inevitably require densification of urban and suburban areas of a nature that can be perceived as ‘character-changing’ – resisted even within those areas, as at Cockfosters – as well as the extension of settlement boundaries onto previous countryside and greenfield sites, invariably involving some change in rural character and views, occasionally, including some release of Green Belt land.
  3. Some element of central compulsion is and will continue to be required to increase housing supply at the local level, as left to themselves LPAs – exposed to well organized and vocal opposition to new developments from ‘insider’ residents often for reasons that often are understandable and defendable according to their own perspective and interests –will tend to bow to such pressures, especially outside the urban concentrations, which could even be described as local democracy or community accountability at work.
  4. A problem with existing mechanisms of central compulsion, including the use of the Planning Inspectorate to overturn local planning refusals following developer appeals, is that some speculative relatively low density ‘executive box’ or otherwise inappropriate developments are approved, weakening incentives for future developers to select the most sustainable sites and provide dwellings in location and composition of the most local benefit. In many ways, the worst of all worlds occurs where the planning process is elongated by delay and obfuscation at a local level resulting in increased scheme costs and the ultimate realisation of less local benefit, such as this .
  5. The relationship between new speculative market developments – the primary provider of new housing – and the meeting of local housing needs is often tenuous and weak. The phase one Turnden Farm scheme in Cranbrook, for instance, only offered c32% affordable housing, comprising completely shared ownership (SO) dwellings – contrary to the local affordable housing policy that required 75% social rent. These units, as a minimum, will require a £99,000 market share to be purchased along with monthly rental and service charge outgoings of at least £632 in a location that will rely largely upon car use (it is a close to a mile from the nearest shops and will be served by limited public transport).  The Registered Providers (RPs) consulted by TWB considered that it was not a suitable location for affordable housing and declined the council’s invitation to make an offer for the proposed shared ownership properties.
  6. The policy uncertainty engendered by the PWP process and then the December 2020 NPPF revisions during the lead up to the May 2023 local council elections, which will continue to the expected forthcoming 2024 general election and then most probably with a new government initiating and no doubt embarking a further round of fresh reforms and associated consultations, led to LPAs demonstrably delaying the progression of new Local Plans provided with an up-to-date locally determined 5YHLS, hoping that the NPPF revisions, if further tweaked, could release them from the presumption of sustainable development applying regardless of their 5YHLS position. An effective Local Plan-based system presupposes that they are prepared, consulted, examined, and maintained within or very much closer to the timescales set in the PWP and then LURB: an outcome that most LPAs are not geared up to achieve, or as shown, many are even desirous of insofar that it requires them to identify more local sites for development to meet higher housing need figures.
  7. Greenfield former agricultural sites should offer the most potential land value capture for public benefit, but the case examples offer some evidence that District Council LPAs could be less sharp and systematic in their attempts to maximise affordable housing contributions from developers than they need or should be. The achievement of 35per cent affordable housing, where it is composed mainly of accommodation of intermediate housing that is still locally unaffordable could be improved upon, or at least be more tightly defined. That said, it is very difficult for individual LPAs to buck the existing speculative housing model, which itself needs to change for sustainable higher levels of affordable new housing supply to be achieved, an issue that will be subject to dedicated consideration in a later extended post.

4          Future Prospects

The May 2023 election results led to the loss of over 1,000 Conservative councillors with the largest losses occurring across the South-east. There nearly all district councils, as shown in this BBC  graphic, ended up under no overall control, but with the Medway and Thanet towns and Brighton and Hove shifting to Labour, and Eastbourne to the Liberal Democrats, while in Surrey Heath, Michael Gove’s local council also came under Liberal Democrat control.

If his backtracking on the PWP and standard method was designed to bolster Conservative local electoral performance, the effort was not successful, and could have proved counterproductive insofar as it highlighted fluctuating government policy.

Evidence suggests that expressed electoral support for new housebuilding and NIMBYism is quite evenly split. The Centre for Policy Studies recently pointed to polls showing support for local housebuilding and for lower and more stable house prices. But such polls are predicated at the general abstract, rather than the more focused local decision-making individual application level.

Similar such polls also indicate that most people believe that public expenditure on public infrastructure and services should increase; that result does not necessarily translate into electoral support for taxes perceived to directly impact on future household budgets.

It seems likely given some shift to support to local resident group candidates that local concerns over development played a part in the dislodging of incumbent Conservatives in places like Wealden, Windsor and Maidenhead, and Tunbridge Wells.

Although the Conservatives  lost control of South Gloucestershire Council to no overall control following a strong showing by both the Labour and Liberal Democrats, where it was reported Labour’s messages of providing more homes ‘resonated’ more strongly than did the Conservative’s recent move away from a pro-housebuilding stance, but that seems empirically to be an exception to the general tendency that local electorates increasingly dominated by older age and higher income groups proved antipathetic to councils perceived pliant to new developments considered detrimental to their local living environment, whether that was true or not given the applicable planning context, as was demonstrated again at the case example councils mentioned above.

In the wake of the May results, Sir Keir Starmer put Labour in the vanguard of the ‘builders’ against the ‘blockers’, promising that Labour would reverse the proposed changes to the December NPPF connected with lower local housing targets, it would be more flexible on Green Belt land release and that it would ensure more “high quality, genuinely affordable housing’ through planning reform and by giving local councils more powers to compulsorily purchase land for housing at lower cost.

Meanwhile, Ed Davey, claimed for the Liberal Democrats the mantle of record council house builders and that his party’s approach was “community not developer-led”, unlike the “the Tories who get 25 per cent of their money from developers”. Their preferred national housing target is 380,000 – patently a meaningless throw-away without demonstrable policy and capacity backing.

All the main party leaders strive rhetorically to reconcile such claims of community accountability with the increased housebuilding that is needed economically and socially, without explaining how they would overcome local resistance to building by consent rather than by more refined methods of central compulsion.

Given that Labour is committed to ‘ironclad’ fiscal responsibility and the wider need for increased financial support for the NHS on top of its borrowing for Green-related investments, it is difficult to discern the prospects for significant increases in public investment on affordable housing, unless housing was subsumed within its wider stated economic mission.

More likely, if elected, it would encourage and preside over more self-financed council housebuilding, as well as put greater emphasis on increasing the proportion of affordable housing requirements taken by social rent.

The problems it would face other than its self-imposed fiscal restraint, include the limited number of Labour Councils elected outside London, the north-west, and some other urban centres with their own housing stocks, and the fact that social housing and its allocation processes largely does not cater or appeal to ‘aspirational strivers’ priced out of market housing.

The economy certainly requires more and better social transport and housing infrastructure to foster further agglomeration of high skill and value-added activities in areas, such as the Oxford and Cambridge Arc.

Labour has indicated that it will rekindle that project. Again, however, it has not spelt out how it would other than relying upon local initiative, the sources of which are not apparent.

High interest rates, and construction costs, as well as wider economic uncertainty is likely to mean new private housebuilding activity will continue to flatline over the short-to medium term. Given that and above considerations, a 300,000 national target appears over optimistic, a banner for political show, rather than a feasible, if challenging, policy objective, seriously sought and supported by the necessary overarching central government policy clarity and certainty.

A more realistic 250,000 rising to 275,000 target that underpinned and correlated with supporting planning reform and increased land value capture might well offer faster and more effective progress.

Please submit comments/questions to asocialdemocraticfuture@outlook.com

Share this:

  • Click to share on X (Opens in new window) X
  • Click to share on Facebook (Opens in new window) Facebook
  • Click to print (Opens in new window) Print
  • Click to email a link to a friend (Opens in new window) Email
  • Click to share on WhatsApp (Opens in new window) WhatsApp
  • Click to share on LinkedIn (Opens in new window) LinkedIn

Filed Under: Housing, Macro-economic policy

Land Value Capture: Potential and Limits

29th April 2023 by newtjoh

What is land value capture? Broadly defined, it involves mechanisms to transfer or use (capture) uplifts in land value for public benefit and purposes rather than for private gain.

Across east Asia, society-specific institutional models of effective direct public land acquisition, development, and commercial release have comprehensively captured land value increases for public benefit.

South Korea, Singapore, and Hong Kong, in different ways have used state ownership and management of development land to help finance the provision of mass housing and transit systems, allowing direct tax burdens to be kept low, a combination that over recent decades have been integral to their wider, cumulative, and transformative sustained economic development outcomes.

Western European countries, including France, Germany, and the Netherlands, allow greater scope for public authorities to finance sub regional and local regeneration projects and supporting infrastructural investment through land adjustment and pooling mechanisms embedded in their planning systems.

These tend to deflate the component of development cost taken by land acquisition allowing sponsoring public authorities to at least partially recover public infrastructural investment that then unlocks further future predominately private investment in housing and employment-creating enterprises with local self-sustaining multiplier effects.

Previously in the UK, the post war New Town Development Corporations were able, using long-term fixed rate public loans (initially at 3%), to purchase mainly agricultural or other land at or close to their existing use values to develop them for housing and commercial purposes.

That made it possible, according to a 2006 government-commissioned evaluation  of the programme and its transferable lessons, to reduce the unserviced land cost component of houses in Harlow and Milton Keynes only about one per cent of housing costs at the time.

Through subsequent disposal of property assets and rising nominal real rental income rolls some of the early New Towns, including Harlow, Bracknell, and Stevenage accumulated surpluses sufficient not only to repay their Treasury loans but to remit substantial sums back to the public purse.

However, their sensitivity to the wider economic performance of the local sub-regional economy they were situated, as well as to the higher interest rates less buoyant national economic environment that shrouded the stagflationary seventies and recessionary early to mid-eighties, led to growing financial deficits for others. Runcorn, for instance, was still in deficit in 2006.

Land value capture mechanisms in their broadest sense can include land, property, and capital taxes covering all landowners.  These tax increases in land value or real estate (combined land and property value treated as an imperfect proxy for land value) are taxed recurrently or on transfer.

Such treatments possess the potential advantage of horizontal equity – all owners benefiting from a similar increase in value are taxed (subject to thresholds, allowances, and exemptions) on the same basis and progressive to the extent that liability is increases with property values.

In the UK no recurrent pure land tax – the most economically efficient tax – is levied. The main property tax in England, council tax, is calibrated to 1991 dwellings valuations that do not separate but combine dwelling and land values. It is levied on a demonstrably regressive basis, poorly or negatively related to current values and household income.

Business rates, currently revalued every five years, are partially but imperfectly calibrated to changes in underlying land values. Capital gains tax is also payable on land transaction profits, but a lower and less progressive rate than is income.

As the fiscal austerity ushered-in by George Osborne in 2010 dragged on well into the decade, an overlapping technical and political consensus on the need for increased land value capture grew.

Self-imposed constraints on public infrastructural and housing investment, political unwillingness to levy salient taxes directly on income and expenditure, declining levels of owner occupation within younger age groups (Generation Rent) amid wider concerns on wealth and generational inequalities, provided political drivers. Studies, such as Griffiths of the Institute for Public Policy Research (IPPR) in 2011, helped to provide evidential foundations.

The emerging consensus increasingly interlinked rising land values to housing market imperfections and malfunction, to housing unaffordability, and to falling levels of, and access to, owner occupation, as well as to infrastructural shortfalls relative to national housing and economic needs.

Given the undeveloped and limited role that general land and property taxes play in the current UK taxation system and the political problems and obstacles involved in increasing their scope, land value capture mechanisms of greater specificity attracted most of the available policy attention.

S106 accidently had become a de facto tax on development value and betterment, while the Community Infrastructure Levey (CIL) was introduced in 2010.

The London CrossRail project was partially funded from 2010 onwards by a Business Rate Supplement, followed in 2012 by a dedicated  Mayoral Community infrastructure Levy.  Both additional levies helped to forward finance this piece of strategic regional infrastructure, which did not come on stream until 2022.

In the short time CrossRail has been operating, usage rates have surpassed expectations. Ample grounds for confidence exist that its future total economic (taking account of not only fare income, but of wider external economic impacts on reduced journey times, congestion, and increased connectivity) benefits will exceed costs.

On the other hand, the linkage between individual contribution of the levies and benefit from the project was delayed; some business owners subject to the additional rate faced increased contribution costs and went of business (for a variety of reasons) before the project was completed. No direct link between contribution and benefit existed, whether derived from increased business profits or capitalised higher land and business premise capital values.

Attention on land value capture peaked across 2017 and 2018. In the wake of the June 2016 Brexit referendum vote, the resulting ouster of David Cameron and George Osborne from 10 and 11 Downing Street, followed by the installation of Theresa May as prime minister, the government’s political commitment to fiscal austerity waned as it became more outwardly sympathetic to an interventionist approach to housing policy, extending beyond the demand-price-and profit-augmenting Help-to-Buy scheme.

May’s government, in February 2017 published a Housing White Paper  (HWP). Its title – Fixing our Broken Housing Market – spoke volumes on the sea change on Conservative party thinking that had taken place since the eighties on the private operation of the housing market. Much of its diagnosis echoed that of Griffith earlier in the decade.

The 2017 Conservative manifesto committed a future Conservative government to “work with private and public sector house builders to capture the increase in land value created when they build to reinvest in local infrastructure, essential services and further housing, making it both easier and more certain that public sector landowners, and communities themselves benefit from the increase in land value from urban regeneration and development”.

Policy changes that followed either side of the June 2017 general election included tightening up on the central definition and monitoring of new local housing targets; the setting of a national annual new housing target of 300,000 dwellings; an increased affordable housing budget; and making it easier for councils to self-fund new council housing again.

Shelter earlier in 2017 had published New Civic Housebuilding. Its core argument was that the speculative market model incentivises developers to squeeze development costs to maximise what they can bid and pay for land sites and thus not lose them to rivals.

They then trim back affordable and other planning obligations, development quality and space standards, and project build out rates to maximise or at least maintain their expected profit levels.

The illustration was made of a developer providing 500 homes comprising 15% affordable housing, no school, a smaller park, and a slow build out rate, paying twice as much (£40m cf. to £20m) for the underlying land than a rival one offering 50% affordable obligations, a school, a larger park, and a faster build out rate. In Shelter’s reading, the additional £20m paid for the land meant a corresponding loss in community and public benefit.

It proposed, in response, a new ‘Civic’ housebuilding model that by “bring(ing) in land at a lower, fairer cost” and channelling competition between firms to raise “the quality and affordability of homes, would be supplemental and in preference to the existing speculative market and directly funded public delivery models.

New Home Zones should also be introduced as “an exceptional planning tool to deliver very high-quality schemes in addition to what the speculative market is building”, covering large scale developments (over 500 units).

Land assembly and acquisition and planning consent for such zones should be both fast tracked and combined through the Nationally Significant Infrastructure Project (NSIP) planning process, compressing development profiles to 12–15 months.

Another key proposal was that the 1961 Land Compensation Act should be amended to take no account of prospective planning permissions; certificates of appropriate alternative development would also cease to apply.

Later that year,  Thomas Aubrey, then Director of the Centre for Progressive Capitalism (now the Centre for Progressive Policy) and Derek Bentley of Civitas likewise argued for the 1961 Land Compensation Act to be amended to exclude prospective planning permission from being taken into account for compensation purposes.

Changing the CPO rules, according to Aubrey would allow public authorities to capture the rise in land values resulting from expected or permissioned change to residential use, estimated at c £9.3bn per annum (over £185bn over 20 years).

The land so acquired could then be serviced with supporting infrastructure, thereby unlocking its potential for residential or commercial development. It could then be either sold back at its new enhanced market development value to private developers and/or retained in public ownership (in full or part) to generate a permanent revenue stream.

In August 2018 a public letter to the Communities Secretary, the late James Brokenshire, signed and supported by a diverse range of campaigning organisations, public stakeholders, and MPs,  co-ordinated by the centre-right Onward think tank (subsequently republished on-line, as per link), encapsulated the overlapping technical and political consensus that had emerged.

“The root of England’s housing crisis lies in how we buy and sell land. When agricultural land is granted planning permission for housing to be built, the land typically becomes at least 100 times more valuable.

We, the undersigned, believe that more of this huge uplift in value should be captured to provide benefits to the community. If there was more confidence that more of the gains from development would certainly be invested in better places and better landscaping; in attractive green spaces; and in affordable housing and public services like new doctors surgeries and schools, then there would be less opposition to new development and much better infrastructure. The Government should think radically about reforming the way we capture planning gain for the community.

First, they should monitor the implementation of their welcome changes to Section 106 to ensure that councils deliver and developers do not continue to wriggle out of their commitments.

Next, they could give local government a stronger role in buying and assembling land for housing, allowing them to plan new developments more effectively, share the benefits for the community and approve developments in places local people accept.

Most importantly, they should reform the 1961 Land Compensation Act to clarify that local authorities should be able to compulsorily purchase land at fair market value that does not include prospective planning permission, rather than speculative “hope” value”.

The Conservative parliamentarian, and former Head of Policy for David Cameron, Sir Oliver Letwin, who had been commissioned in Autumn 2017 to: “explain the significant gap between housing completions and the amount of land allocated or permissioned in areas of high housing demand, and (to) make recommendations for closing it”, published his draft report  in June 2018.

It reported that there were then approximately 107 sites in England with permission for approximately 393,000 units, associated with an average build out rate of 15.5 years, or 6.8% per year.

Letwin’s analysis and prescriptions shared similarities with the Shelter Civic Housebuilding report, focusing on slow build out rates inherent within the existing speculative market business model. Its core3 commercial driver was to limit releasing dwellings for purchase to a level (market absorption or build out rate) commensurate with them maintaining target sales prices and hence their target capital return.

Although accelerating that build out rate could significantly increase housing supply, the “homogeneity of the types and tenures of the homes on offer on these sites, and the limits on the rate at which the market will absorb such homogeneous products, are the fundamental drivers of the slow rate of build out”, according to Letwin.

In September 2018 a Housing Communities and Local Government Select Committee Report on Land Value Capture was published.

One of its central conclusions was that as the value of land arising from granting of planning permission and of new infrastructure was largely created by public action, then a “significant proportion of this uplift (should) be (made) available to national and local government in new infrastructure and public services”, through reforms to existing taxes and services, to compulsory purchase powers and compensation arrangements, or through new mechanisms of land value capture.

The committee had considered evidence (as did Barker) that practice in some other European Union (EU) countries can involve the freezing of land values when land is vested for housing use by a local authority.

It noted that across these countries, compared to the UK, land accounts for a smaller proportion of total residential development value, build rates are much higher, and they exhibited much more steady house price trends: outcomes all supportive of the wider macro-economic ends of steady, balanced non-inflationary growth.

The committee also noted (para 105), however, that during its visits to Friberg in Germany, and to Amsterdam in Holland, local municipalities did not acquire land at either existing or full use value but instead at a value “that offset the cost of providing the infrastructure and services associated with making a development viable”.

In October 2018, Letwin published his final report. It recommended that planning policy for sites providing over 1,500 units in high demand areas should be revised.

LPAs should be given the power to designate areas within their local plans to be developed only as single sites in conformity with a masterplan and set quality design codes, designed to diversify the mix, size, and type of units provided.

Such diversification would then allow LPAs to capture more land value and secure faster build out rates.

Government funding support would be made conditional on S106 conformity with such principles.

LPAs should also be provided with clear statutory powers to compulsorily purchase the land designated for such large sites at prices “which reflect the value of those sites once they have planning permission and a master plan that reflect the new diversity requirements …. to the point where they generate a maximum residual development value for the land on these sites of around ten times existing use value rather than the huge multiples of existing use value which currently apply”.

Their exercise would involve either use of a Local Development Corporation (LDC) or Local Authority Master Planner (LAMP).

LDCs would have a remit to set a masterplan and design codes(s) for designated sites and then obtain private finance to pay for the land and infrastructure through a specially established special purpose vehicle, before then “parcelling-up” the land to sell to different builders in accordance with its masterplan and design code(s).

A Local Authority Master Planner (LAMP) would sell the land to a privately financed Infrastructure Development Company (IDC), which would then provide the infrastructure and promote the same diverse housing offer.

The government response to his recommendations was lukewarm. In March 2019, the late James Brokenshire, the Communities Secretary, in a ministerial statement  agreed that the “increased costs of diversification should be funded through reductions in residual land values” but cautioned that the report’s recommendations had been received with some scepticism within the housebuilding industry.

He went on confirm that while the government was committed “to improving the effectiveness of the existing mechanisms of land value capture, making them more certain and transparent for all developments”, his focus was “on evolving the existing system of developer contributions to make them more transparent, efficient and accountable”.

UK politics by then had long been dominated by Brexit, which now, to all intents and purpose, took over the entire show. Since May’s botched 2017 general election campaign, she had struggled in vain to secure a parliamentary majority for her compromise exit deal.

Her failure to do so culminated in her long-anticipated resignation and replacement by the opportunist Boris Johnson in July 2019 on a promise to ‘get Brexit done’, whatever.

Sir Oliver, old Etonian and former Thatcherite who had evolved into a Conservative ‘one nation’ Remainer grandee in manner and conviction, had the party whip taken away from him by Johnson in September 2019 and then retired at the December election that Johnson and his key advisor, Dominic Cummings, had engineered.

Johnson was returned with an eighty-plus mandate to get, indeed, ‘Brexit done’. Letwin’s report remained on the library shelf as he receded into principled retirement.

The growing overlapping technical and political consensus that had grown for the need for land value capture and wider housing market reform was discernible enough for commentators to note that the Communities Secretary, Sajid Javid, appointed by May when she became prime minister in July 2016 and in that post until April 2018, sometimes sounded more like a ‘Labour Housing Minister’. Toby Lloyd, the author of the 2017 Shelter report, had become May’s housing advisor.

The actual housing minister from July 2016, Gavin Barwell, who after losing his Croydon seat in the June 2017 general election became Theresa May’s chief of staff, in a subsequent book, identified delays and problems that Javid and himself faced progressing the HWP, noting that long-awaited Treasury and 10 Downing Streets responses to departmental policy submissions were “often contradictory”.

May’s chancellor, Philip Hammond, was a fiscal conservative wary of housing policy actions that could increase the deficit and undermine fiscal rules.

And, in any case, the HWP was more well-meaning rhetoric than a base for concrete policy change consistent with the refashioning of the housing system and market it desired – at least without overarching political and institutional drive and commitment. That was absent, whether due or not to the on-going all-consuming Brexit hiatus.

Public policy action in practice was largely limited to changes to the S106 viability process – again led by judicial decision – and to the compulsory purchase legal framework.

S106 viability methodology and process

After the introduction of CIL, the next major landmark in planning policy and practice was the publication in March 2012 of the National Planning Policy Framework (NPPF).

The original 2012 NPPF  commendably consolidated 44 previous central government policy or guidance documents into one 65 page document.

It confirmed that the commercial viability of a development was a material consideration, which LPAs could take account of when setting, or, in the case of stalled schemes, when reviewing planning obligations.

Paragraph 173 advised LPA’s “To ensure viability, the costs of any requirements likely to be applied to development, such as requirements for affordable housing, standards, infrastructure contributions or other requirements should, when taking account of the normal cost of development and mitigation, provide competitive returns to a willing landowner and willing developer to enable the development to be deliverable“.

Paragraph 205 went on to advise that where obligations were being sought or revised, LPAs should take account of changes in market conditions over time and, wherever appropriate, exercise flexibility sufficient to prevent planned development stalling.

Further dedicated guidance issued in 2014 on viability (2014 viability guidance) further noted that “Where an applicant is able to demonstrate to the satisfaction of the local planning authority that the planning obligation would cause the development to be unviable, the local planning authority should be flexible in seeking planning obligations.

This is particularly relevant for affordable housing contributions which are often the largest single item sought on housing developments. These contributions should not be sought without regard to individual scheme viability. The financial viability of the individual scheme should be carefully considered in line with the principles in this guidance”.

A site was viable if the value generated by its development exceeded its total cost and offered sufficient incentive for the land to come forward and then for the development to be undertaken.

The most common way of measuring project viability was (and is) to subtract its expected Gross Development Cost (GDC) from its Gross Development Value (GDV), leaving its Residual Land Value (RLV).

If its RLV was positive and greater than the Benchmark (or Threshold) Land Value (BLV) – defined as the price at which a reasonable landowner would be sufficiently incentivised to sell – the scheme was deemed viable: (GDV-GDC=RLV)>BLV.

The 2014 viability guidance advised that in all cases, estimated land or site value should meet three policy requirements:

  • Reflect emerging policy requirements and planning obligations and, where applicable, any Community Infrastructure Levy charge;
  • Provide a competitive return to willing developers and landowners;
  • Be informed by comparable, market-based evidence wherever possible.

Their order of priority was left open, however. Should local Plan-set S106 and CIL requirements override evidence adduced from past market sales of comparable sites? And what was an ‘acceptable’ return for landowners and developers?

Developers and their advisers could over- and under-estimate expected values and costs, respectively.

Different assumptions to determine BLV that could include current use value, a premium above that value, alternative use value, as well as market values extrapolated from, say, average sale values for comparable sites, could be applied.

Local S106 and other policy requirements could also be set at different points across the economic and housing cycle not necessarily coincident with conditions prevailing at the time of viability consideration at either Plan or individual scheme level.

The heterogeneity of sites and their associated development value potential also do lend themselves to the application of standard assumptions or requirements.

The 2014 guidance also encouraged the use of scheme-based development viability appraisals to assess the impact of affordable housing obligations on the overall commercial viability of previously agreed section 106 affordable housing obligations, as well as planned new developments, undermining the principle that viability should be assessed as part of the Plan-making process.

These issues and problems remain, but developers (despite many of them receiving substantial public support) during the post GFC years exploited them.

They continued to overpay for land. By reducing site RV to below or close to its BLV they made the argument that LPA enforcement of local policy-defined section 106 obligations – often previously agreed- would now make their scheme(s) unviable. Averaged market values of (sometimes) comparable sites that did not reflect S106 or other planning requirements was also used to the same purpose.

Indeed, the inference many developers took from the 2014 viability guidance was that affordable housing obligations should be considered a variable parameter (their incidence in scale and timing was conditional on not making a development inviable), whereas the need to provide a(undefined) competitive return to a willing landowner and developer was the fixed primary parameter that must be achieved regardless of context, history, and circumstance.

Such entrenched circularity (overpaying for  land made developments unviable, with the resulting unviability then used to justify to reduce the level of housing and other obligations: a process that then further encouraged developers to over pay for land, and so on) provided the backdrop to the April 2018 Parkhurst Road High Court judgement.

This provided a judicial review of earlier 2015 and 2017 planning inspector inquiries convened to consider previous refusal(s) by the London Borough of Islington Council (LBI) of planning applications from the developer, Parkhurst Road Ltd (PRL). The refusals were primarily on the ground that insufficient affordable housing had been offered consistent with LBI published and approved Plan policies.

LBI further contended that the price which PRL had paid for the ex-Territorial Army site was excessive, since it did not properly reflect the policy requirement to maximise the affordable housing component on the site in the context set by LBI’s 50% borough-wide strategic affordable housing target.

 The borough suggested that a viability assessment should look at comparable sites that had been recently granted planning permission in accordance with relevant policies. The prices paid for such land, suitably adjusted, could then be compared to EUVs for those sites to ascertain an appropriate premium or uplift additional to EUV for the Parkhurst Road site.

That approach aligned with that adopted Mayor of London’s Affordable Housing and Viability Supplementary Planning Guidance (2017 SPG), incorporated into the 2021 London Plan that stated that a market value approach should only be accepted where it can be demonstrated to properly reflect policy requirements and take account of site-specific circumstances.

LBI assessed the BLV value of the site on that basis as £6.75M – around a half of the £13.25M paid by Parkhurst, but still significantly above the site EUV.

The judge, Mr Justice Holgate, concluded that LBI’s assessment of the BLV site value was correct, based as it was on its set affordable housing policy requirements. These, he added, could not be ignored nor set aside by a developer claiming that ‘comparable’ site valuations were higher, where such valuations did not take account of the borough’s affordable housing requirements.

 In short, he concluded, LPAs when determining site BLVs, should “reflect“, and not “buck,” relevant planning policies (including those for the delivery of affordable housing); on the other hand, the proper application of those policies should also be “informed by,” and not “buck” an analysis of market evidence reflecting those policies.

On the other hand. an “arbitrary” EUV plus valuation, Justice Holgate went on to say, should also not be applied,  where viability evidence of comparable market values that did reflect relevant planning policies and requirements was presented. One or more planning requirements or objectives could then be relaxed where if they would render a development non-viable, according to a viability case “which uses (inter alia) land values which have adequately taken planning policies into account”.

It may be noted in passing that Justice Holgate – understandably, concerned as he was with the law rather than with economics – did not delve further into the extent that ‘market’ evidence could reflect imperfect rather than efficient housing market operations.

Subsequent published 2019 Viability Guidance confirmed that “under no circumstances will the price paid for land be relevant justification for failing to accord with relevant policies in the Plan”.

LPAs should apply existing use value plus’ (EUV+) as a calibrating mechanism to measure BLV with any hope value disregarded, save, apparently, where an alternative use value (AUV) when fully compliant with up-to-date development plan policies could be implemented on the site in question including evidence for market demand for such use.

Specifically, BLV should:

  • be based upon existing use value, “not the price paid and (it) should disregard hope value” (but note AUV rider above)
  • allow for a premium to landowners (including equity resulting from those building their own homes) that “should provide a reasonable incentive for a landowner to bring forward land for development while allowing a sufficient contribution to fully comply with policy requirements”;
  • reflect the implications of abnormal costs; site-specific infrastructure costs; and professional site fees.

Such BLV appraisal values then should fully reflect all relevant policies, local and national standards, including the cost implications of the Community Infrastructure Levy (CIL) and section 106 obligations.

Compared to the 2014 version, this latest 2019 iteration of the viability guidance also appeared to reduce the ‘required return’ to a ‘minimum return’ which was ‘reasonable’ rather than ‘competitive’.

It suggested that 15-20% of gross development value (GDV) should be taken for plan viability purposes as an assumed presumably ‘reasonable’ return to developers (profit parameter). This could vary, however, according to the type, scale, and the risk profile of planned development(s).

Specifically, a lower return may be more appropriate “in consideration of delivery of affordable housing in circumstances where this guarantees an end sale at a known value and reduces risk”.

Developers should also account for and price potential risk within their assumed return: it was for them, not plan makers or decision makers, to later mitigate these risks.

Noting that there may be a divergence between benchmark land values and market evidence the guidance, plan makers “should be aware that this could be due to different assumptions and methodologies used by individual developers, site promoters and landowners”.

LPAs, consistent with the revised 2018 national planning policy framework, should set out the contributions expected from development(s), including the levels and types of affordable housing provision required, along with education, health, transport, flood and water management, green and digital infrastructural requirements. These should be supported by evidence for their need and not undermine their deliverability.

The guidance reiterated that viability assessment should occur primarily at the plan making stage, although it recognised that “in some circumstances more detailed assessment may be necessary for particular areas or key sites on which the delivery of the plan relies”. The onus was put upon developers to justify the need for any further viability assessment at the application decision-making stage.

LPAs were charged at the plan-making appraisal stage to use ‘site typologies’ to set different requirements for different types of development and locations consistent with their deliverability.

This could involve plan-makers making use of average historic land values and costs to allow them to “come to a view on what might be an appropriate benchmark land value and policy requirement for each typology”.

In summary, it took government many years to catch up with abuse of the appraisal process by developers who demonstrated their willingness as profit-maximising organisations to adopt ‘take a mile, if given an inch’ approach to public policy adjustment to the impact of the GFC on the housing market and construction industry.

It is likely that such practice helped to fuel the overlapping political and technical consensus in favour of increased land value capture that that grew last decade.

The 2019 appraisal policy practice government guidance remains extant. Recently republished RICS guidance interprets and operationalises its application as a professional standard for surveying practitioners.

Tension, and a degree of uncertainty, remains concerning the application of EUV+ valuation of Benchmark Land Value and the related issue as to extent that hope value should be eliminated in its computation. The distinction between hope and alternative use values appears unclear and possibly contradictory.

The premium element of EUV+ and its ranking and ordering relationship to the developer profit and set policy requirements remains indeterminate, and, perhaps, inevitably so given site heterogeneity and changes to the wider economic and housing market environment.

The experience of CIL suggests that a focus appraisal undertaken at Plan-making will be reliant on local capacity, while the use of average historic market value data and their shortcomings could result in misspecification of viability and/or a worst-case assumption applied. In any case, most LPA’s do not have an up-to-date Local Plan, which are seldom refreshed at the expected five-year intervals.

Compulsory Purchase Order (CPO) reform

To begin to understand policy development and issues across this devilishly difficult and confusing area, some history is needed.

The 1947 Town and Country Planning Act nationalised both the private right to develop (undertake construction and/or change its use) sites and to profit from any increase in their development value (betterment).

Development henceforth could only proceed subject to planning permission. A 100% development charge would also be levied on betterment. Owners could now only realise, net of the charge, the existing use value of their land.

But in 1954, Winston Churchill’s successor Conservative government abolished development charges. Local authorities, however, retained the right to acquire land at its existing use value thus facilitating continuing council house building at manageable public cost, as did New Towns.

As the demand for land suitable for development rose in response to the government’s wider housebuilding drive, its market value, when traded, increasingly took account of its future prospective use, while land acquired publicly did not.

The resulting dual or ‘two-price’ system threw up the horizontal inequity that landowners with similar plots could get different values depending on whether their land was subject to public acquisition or not.

The 1959 Town and Country Planning Act ended that dual system by making provision for CPO compensation at what it termed ‘fair market value’ in conformity with the principle of ‘equivalence’: requiring the forced seller to be placed in the same position as they would have been in the absence of the CPO acquisition.

In practice, local authorities acquiring land for new council building schemes now had to pay prices reflecting its future perspective or ‘hope’ residential value.

But, as was pointed out at the time and subsequently, the 1959 Act did not address other horizontal inequities resulting from a system where development control and rights continued to vest with the state, but land value uplift or betterment could be realised by private actors.

Some landowners could benefit and realise betterment from the granting of planning permission. Others could not because their land was not zoned for development or because permission was refused. This remains the case.

The 1961 Land Compensation Act (1961LCA) then consolidated statutes dating back to Victorian times and codified case law.

But by common consent it did so in a confused and conflicted manner. That was, perhaps, inevitable insofar that the case law that it tried to codify was sometimes contradictory and the statutes that it attempted to consolidate, rather than to reform or replace, reflected changing circumstances and assumptions occurring over a century.

In Victorian times, for instance, compulsory purchase powers were generally sought and obtained by private competing profit-making operators, such as railway and water companies by privately sponsored specific Act of Parliament, and local juries decided compensation on that basis.

A 2003 Law Commission review of Compulsory Purchase compensation arrangements, in that light, noted that the “The current law of compulsory purchase is a patchwork of diverse rules, derived from a variety of statutes and cases over more than 100 years, which are neither accessible to those affected, nor readily capable of interpretation save by specialists”.

Nevertheless, 1961LCA remains the principal source statute governing the assessment of CPO compensation, notwithstanding that many of its provisions have been amended significantly by subsequent pieces of legislation, sometimes substituted then back into it.

Its Section 14 (s14) gave statutory status to the ‘no scheme’ principle, whereby for compensation purposes any impact on plot value attributable to ‘the scheme’ subject to the CPO was to be disregarded as if no such scheme existed or it was ‘cancelled’ on the valuation date (the date when compensation was determined or when it was taken in possession, if earlier).

It went on to provide for the payment of compensation at market value to reflect permissible and prospective planning use (hope value) and in respect to appropriate alternative development (AAD), “in (the) circumstances known to the market at the relevant valuation date”.

At first glance, interpretation of the ‘no scheme’ or the project disregard rules seems straightforward. If land is to be acquired, compensation should reflect its fair market price “taken to be the amount which the land if sold in the open market by a willing seller might be expected to realise” after applying the assumption that the ‘scheme’ subject or giving rise to the CPO requiring the acquisition was ‘cancelled’ – in effect, did not exist.

Assessing potential hope value is inherently problematic, however. To do so also involves postulating what uses the subject land in question could have been put to in the absence of ‘the scheme’.

For instance, some or all of it could have been zoned for housing or other alternative uses sometime in the future, even though its existing use was agricultural and there was no current planning provision for its future use for housing.

The wider the scope that ‘the scheme’ is in area and purpose, the more difficult it is likely to become to isolate what might have happened in its absence: a wider regeneration scheme possessing sub-regional importance with multiple underlying purposes is likely to affect many more owners, take longer to bring to fruition, and have much more extensive and varying impacts over time.

In the words of the Law Commission, especially when the scheme has a long life, this “may involve a speculative exercise of rewriting history”. Or, put another way, gazing into a crystal ball.

This issue arose in a 1974 Court of Appeal case (Myers v Milton Keynes Development Corporation, MKDC) presided over by the then Master of Rolls, Lord Denning.

In short, MKDC had acquired 324 acres of Myer’s land (designated as part of a New Town scheme to provide housing) at twice agricultural value.

A lower court held that the assumed planning permission was a direct result of the acquiring authority’s ‘scheme’ that must therefore be ignored when assessing compensation.

The Court of Appeal decided, however, that the landowner was rather entitled to 20% of residential value. This it deemed as fair representation, in essence, of hope value pertaining to the assessed likelihood that in the absence of the CPO ‘scheme’ – in this case an extension to Milton Keynes New Town – planning permission for residential use would have been granted sometime in the future.

Such continuing uncertainties provided the backdrop to a consultation on compulsory purchase reform that the former Department of Communities and Local Government (DCLG) and HM Treasury conducted in March 2016 (following an earlier one in March 2015).

Predicated on a central premise that the application of the ‘no scheme’ application as interpreted by case law had in practice become more complex and uncertain over time and that it needed to be made “clearer, fairer, and faster”,  it sought views on government proposals to establish the principle of the ‘no scheme world’ fairly and effectively in the valuation process by codifying it in statute, involving a:

  • clearer definition of the project or scheme that should be disregarded in assessing value;
  • clearer basis for assessing whether the project forms part of a larger ‘underlying’ scheme that should also be disregarded;
  • more consistent approach to the date on which the project is assumed to be cancelled;
  • broadening of the definition of the ‘scheme’ to allow the identification of specified transport infrastructure projects that are to be disregarded within a defined area, over a defined period of time – meaning that where land is acquired for a wider regeneration or redevelopment scheme that is directly linked (facilitated or made possible) to a ‘relevant’ transport infrastructure project, the definition of ‘the scheme’ should include that project.

The uplift in values caused by the public investment in the transport project, regardless of whether it is carried out before, after, or at the same time as the regeneration or redevelopment, should, therefore, be disregarded for compensation purposes, the consultation proposed.

In its published response to that 2016 consultation, the government acknowledged that extending the definition of ‘the scheme’ to exclude the impact of specified transport infrastructure on land values could result in claimants receiving less compensation than they might otherwise have done, but nonetheless noted that “it is right that the public purse, rather than private interests, should benefit from increases in land values arising from public investment”.

These proposed changes were largely enacted in Section 32 of the Neighbourhood Planning Act 2017 (NPA2017) inserted into 1961LPA, replacing former ss6-9 with new ss6A to 6E.

The current legal position is where land is acquired for regeneration or redevelopment facilitated or made possible by a relevant transport project, the definition of ‘the scheme’ will include that project, regardless of whether it is carried out before, after or at the same time as the wider regeneration or redevelopment.

Where different parts of the works comprised in such a transport project are first opened for use on different dates, each part is then to be treated as a separate relevant transport project but only where “regeneration or redevelopment was part of the published justification for the relevant transport project”.

All subsequent development across the whole areas covered by Mayoral Development Corporations and designated New Town or Urban Development is now to be disregarded for the purpose of assessing CPO compensation.

The amount of compensation payable in respect of the compulsory acquisition of the ‘original’ or ‘subject land’ can also be reduced by the quantum increase in the value of the same person’s interest in any adjacent or contiguous ‘other’ land at the relevant valuation date resulting from ‘the scheme’.

However, if the revised ‘no scheme’ assumptions do not apply, the new ss6A-E limit still allows compensation for prospective hope value to be assessed in accordance with s14LPA61.

New powers were also given to the Secretary of State to create Locally-led New Town Development Corporations (LNTDCs) that a local authority, or more than one local authority, would be responsible for, and for Transport for London and the Greater London Authority to jointly acquire land through compulsory purchase on behalf of each other for mixed-use transport, housing, and regeneration purposes.

The Housing Minister, Kit Malthouse, subsequently told the 2018 Select Committee on Land Value Capture (see previous reference link) that he considered the revised ‘no scheme’ principles that NPA 2017 enacted had rendered any further reform of LCA1961 unnecessary.

The published report of that Committee, nonetheless, concluded that (para 111) “the Land Compensation Act 1961 requires reform so that local authorities have the power to compulsorily purchase land at a fairer price (and that) the present right of landowners to receive ‘hope value’—a value reflective of speculative future planning permissions — serves to distort land prices, encourage land speculation, and reduce revenues for affordable housing, infrastructure and local services”.

It went on to propose (para 112) that such a ‘fairer price’ should be set by an “independent expert panel”, before noting (para 113) that enhanced CPO and land assembly powers, alongside further reform of LCA1961, “would provide a powerful tool for local authorities to build a new generation of New Towns, as well as extensions to, or significant developments within, existing settlements”.

Within two months the government published its November 2018 response to the Committee’s report.

This confirmed its commitment to capture increases in land value for the benefit of local communities while cautioning (para 11) that “changes to land value capture systems can have profound impacts on the land market in the short term, even where they are sensible for the long term”.

Compensation for hope value (i.e., value based on the land’s development potential) should be limited to values (para 30) reflecting “the prospects of obtaining planning permission for an alternative development in the absence of ‘the scheme’, taking into account the risks, uncertainties and costs associated with implementing such a development, including the costs of providing the affordable housing, infrastructure and supporting facilities required to make the development acceptable in planning terms, as well as any Community Infrastructure Levy liability”.

Previous government policy guidance, including the 2018 ministerial statement earlier referenced, that developer S106 contributions provide the primary mechanism for LPAs to capture land value uplift, was reiterated.

The government wanted to let recent reforms, including the NPA2017, to ‘bed-in’ while it continued “to monitor their practical application and (to) remain open to considering practical improvements to the (CPO) framework”, including “bespoke mechanisms of land value capture”. The “Oxford-Cambridge Arc and Housing Deals” were mentioned specifically in that regard.

Indeed, the changes made alongside the greenfield amendment recorded below, appear designed to facilitate a strategic project, such as the Oxford and Cambridge Growth Arc  promoted by the National Infrastructure Commission in 2017.

It has suffered from recent policy uncertainty, however, culminating in Michael Gove, reportedly, ‘flushing it down the toilet’, and dismantling the responsible civil service team, although government lip service to its progression still surfaces.

More fundamentally, the respective roles of central government, local authorities remain unclear: it covers too wide an area for a top-down New Town Development Corporation approach, but little evidence exists that constituent LPAs possess either the willingness or capacity to drive progress either at individual LPA or collective sub-regional level. Accordingly, the new 2017 NPA CPO compensation arrangements accorded to New Town Development, whether nationally or locally-led and Mayoral Development Corporations, still may not be applicable across much of the area.

While the government accepted the principle that a greater proportion of land value should be captured for public benefit, it also continued to reiterate that its reforms did not change the bedrock legal principle that compensation should be based on the market value and were made to simply make the CPO process clearer and simpler.

After a four year pause in CPO reform, the Levelling-up and Regeneration Bill, introduced into the Commons in May 2022, put forward further provisions to ensure that where greenfield land is acquired for development that is facilitated or made possible by a relevant transport project, then that any uplift on land values resulting from that that and any linked transport scheme would likewise be disregarded for compensation purposes.

Further government amendments incorporated into Clause 175 of the Bill put the onus and cost of applying for a Certificate of Alternative Development (CAD) under s17 of the LPA1961 onto the landowner/developer.

Compensation will still be payable for ‘hope value’ on the basis that the LPA would have granted planning permission for the alternative use “more likely than not” in the absence of the scheme subject to the CPO.

These amendments also empower LPAs to define planning conditions that it would have attached to any such ‘more likely that not’ hypothetical permission. These, presumably, could include infrastructural and affordable housing obligations impacting on potential compensation values.

In March 2023, the government tabled further amendments at the House of Lords Committee stage, that included 412D to clause 175.

This goes further, insofar – if passed and enacted – it would allow a Minister confirming a compulsory purchase order to direct, in certain cases involving affordable housing, health or education, that compensation should be assessed on the basis that no new planning permission would be granted for the land (and thus eliminate hope value from any compensation payable).

To make the order in the case of affordable housing, the acquiring LPA must state the number of affordable homes to be created and be satisfied that the direction is justified in the public interest.

The effect of that direction could be subsequently reversed if the acquired land is not subsequently used as planned or if a statement of commitments accompanying the CPO was not fulfilled within ten years of the order becoming operative.

In April 2023, the government indicated that it intended it to make changes to the compensation arrangements where valuation takes into account prospective planning permission but directions eliminating or capping hope value should be on a scheme-by-scheme basis and be limited to carefully defined circumstances, but where directions are made they should remove hope value entirely from compensation.

It concluded that certain public sector authorities (eligible acquiring authorities) such as LPAs, Homes England, Development Corporations, and the Greater London Authority (GLA) will be able to seek directions from the Secretary of State that CPO compensation should take no account of the prospects of prospective planning permission (hope value) or establishing appropriate alternative development via a Certificate of Appropriate Alternative Development (AAD) in relation to affordable (including social housing), education provision, and health facilities.

Should hope value be eliminated?

Since the mid-fifties, real land prices (adjusted for inflation) have exhibited bouts of greater volatility within a wider secular medium to long term trend for them to exponentially outpace real house prices (see Figure 1).

Real house prices, in turn, have outpaced average earnings and real disposable incomes, especially and concentrated across the economically buoyant areas of the country.

These trends were accelerated by the financial liberalisation of the eighties that enabled easier mortgage availability at higher income multiples and the secular trend fall in real interest rates that started in the mid-nineties (only recently arrested) that reduced the cost of servicing a mortgage of constant value, which also allowed homebuyers to borrow more relative to their income and price of the home they were purchasing.

Both acted to increase effective monetary demand for housing and hence the demand for residential land.

The supply of developable land, subject to both planning restriction and developer market behaviour, is much more inelastic (less sensitive to price change) than is housing demand, as authors, including Griffith and Letwin, have demonstrated and reported.

The relationship between land and house prices is a complex one that acts both ways. In practice, as described above, market residential land values reflect both market failures and public policy choices.

Construction (C) or build costs increased far less – driven largely by material, labour, and regulatory costs – than did land (L) values that consequently accounted for increased proportions of the total residential plot value.

If C is taken to include other development costs, including financing and marketing, and P for developer profit: H = L+C+P; it follows that the share of combined land and profit share of a dwelling speculatively sold means that L+P=H-C.

By 2020, according to the most recent ONS data, land underlying dwellings accounted for 86% of the total estimated value of land.

Some hard facts can help to paint the real picture. This chart researched and produced by BuiltPlace – an independent group of housing analysts and researchers – highlights how the listed housebuilders have managed to capture the majority of the uplift in house prices in their profit rather than land values.

Staggeringly, average gross profit per plot built by Persimmons in 2022 exceeded £76,000. That year, profit and land costs combined accounted for 43% of total sale price, compared to c38% back in 2010.

Essentially, landowners and developers have been able during the last decade to capture progressively larger windfall gains from changes in land use values in the form of land values and profits.

Such gains are crystallised by planning permission but can also include prospective hope values based on the expectation of future such permissions. They, in effect, represent income transfers from purchasers.

It is that tendency that helped to give rise to the growing pressure documented earlier for hope value to be removed entirely as a potential component of compulsory purchase compensation.

Opponents of such a shift, such as the Compulsory Purchase Association riposte that compensating owners at less than market value is inherently unfair and potentially incompatible with the European Convention on Human Rights, that it would risk inciting opposition to new developments involving compulsory purchase, and it would slow down the process, increase costs, and thereby self-defeat any purported intention to increase infrastructural and housing supply.

Private property rights to windfall and/or super profit gains need to be balanced against competing public interests, such as promoting sub-regional and national economic growth, shared prosperity, and increasing the supply of, and access to, affordable housing, as well as against competing private individual rights to access housing suitable for their needs consistent with their wider effective economic and social participation in society.

The ’human rights’ angle can therefore sometimes be used as a red herring diversion motivated by special pleading or political preference.  Governments restrict individual rights for wider economic and social ends for a variety of reasons and purposes: to weigh the confiscatory and deadweight effects of taxation levies against the need for collectively financed services that they can finance, for instance. Such balancing is the meat and drink of democratic politics.

The real issues revolve around balancing competing degrees of fairness, which tend to merge into shades of grey rather than demarcate into black or white, and the likely effectiveness of interventions in achieving their purported objectives.

In that light, Richard Harwood KC and others argue that CPO compensation is already based on the value of land either in its current use or on the prospect of a planning permission, with that prospect taking account of set planning policy design, size and other quality standards, of infrastructural provision and support, and affordable housing requirements.

In any case, they add, the CPO compensation code does not determine market prices. And, crucially, landowners and developers need to be incentivised to release and use land for housebuilding. Accordingly, further change to the CPO compensation arrangements is neither needed nor desirable.

They recognise from a legalistic perspective that a potential case under European human rights legislation is only conceivable where the gap between compensation and market value is especially large, likely to be confined to greenfield sites. Those are the sites, however, where the landowner windfall gain is likely to be largest providing greatest scope for land value capture for public benefit.

Isolating and attributing land value uplifts specifically to the impact of schemes and their facilitating public investments is inevitably going to be an imprecise exercise subject to contestable assumptions, especially where it involves the delineation of when and to what extent prospective hope value – derived from the prospect of a future planning permission – should be compensated.

It has been a refreshing feature of recent debate on the topic largely has attempted to accommodate that nuanced reality through informed discussion, eschewing polarised and entrenched ideological-based political positions.

On the other hand, it can get a bit circular and semantic, namely that it is OK to compress market values by public policy requirements and interventions but not to cap compensation (even at a premium above existing value) for the same purpose.

In that context, a case can be made that elimination of compensation for hope and alternative use value would further simplify the process and discourage rent-seeking speculative behaviour by developers and land agents.

The core principle of social democracy is to focus on securing the effective and sustainable outcomes – the best that can be achieved in invariably messy ‘present imperfect’ conditions, using individually fair and accountable processes.

The line of least technical and political resistance – following on and progressing on what Harwood describes as a “new consensus on land value capture, which emphasises the effective working of the planning system” would appear to embed design, infrastructural and affordable and housing obligation requirements in a more certain manner.

This means both definitionally and in meshing them to and within future viability assessment and local plan-making process and practice.

Such greater planning certainty should help to deflate land values generally, as well encourage voluntary sales at a premium above existing values at a fair and effective level, consistent with closing local infrastructural and affordable housing provision requirement funding gaps and with providing a reasonable incentive for voluntary land sale.

Letwin’s proposal of a maximum residual development value for the land of around ten times existing use value rather than the huge multiples of existing use value that can sometimes apply seems a reasonable starting point to assess at least the allowable premium for voluntary sale of greenfield sites.

It would also be consistent with using CPO as a last resort and help also to limit the extent of horizontal inequities between landowners where values are uplifted by prospective development.

Aligning property taxes more dynamically to changing values would dilute such horizontal inequities more effectively, but that involves practicability and political feasibility issues, as discussed in Time for a Modern Land Tax?.

On the other hand, certainty of requirements can conflict with site heterogeneity: one size cannot fit all.

Much more clarity is required as to the respective future roles of public and private sectors and their capacity to effectively fulfil them and on associated changes needed to their respective business/provision models to that end, discussed in Affordable_Housing_Partnership_Planning.

At the end of the day, more effective land value capture would expand access to affordable housing through reducing market prices, helping to finance necessary supporting infrastructure conducive to local and sub-regional housing and economic development, this contributing to the future uplifts in economic growth that the nation’s economic and social future depends upon.

But that requires overarching central government policy clarity and certainty connected to a steadfast commitment to securing increased infrastructural investment in line with local affordable housing requirements and economic development needs as part of a wider economic mission to uptick the sustainable  growth rate.

This was, and remains, a key public policy failure of omission that unless addressed and reversed will invariably render any land value capture mechanism ineffective, whatever its label.

Things won’t happen by themselves. The Oxford-Cambridge Arc is a case in point.

This extended post is one of a series concerning housing and planning policy development that will be published during spring and summer 2023.  Comments on this one should be made to asocialdemocraticfuture@outlook.com

Share this:

  • Click to share on X (Opens in new window) X
  • Click to share on Facebook (Opens in new window) Facebook
  • Click to print (Opens in new window) Print
  • Click to email a link to a friend (Opens in new window) Email
  • Click to share on WhatsApp (Opens in new window) WhatsApp
  • Click to share on LinkedIn (Opens in new window) LinkedIn

Filed Under: Housing, Macro-economic policy Tagged With: Compulsory Purchase Reform, Land Value Capture, Oxford-Cambridge Aec

  • Go to page 1
  • Go to page 2
  • Go to Next Page »

Primary Sidebar

Pages

  • Consultation Responses
  • Covid
  • Home
  • Investing in productive infrastructure
  • Wider Housing Ends

Recent Posts

  • Labour’s Planning Reforms: Ends and Means
  • Making the Most of the Budget
  • Social Housing Investment, Fiscal Institutional Reform, and Labour’s Delivery Target
  • The 1.5m Delivery Target: Prospects and Issues
  • Making Sense of the English Housing Statistics

Categories

  • 2018 Housing Policy
  • Brexit
  • CMA Study
  • Consultation Responses
  • Covid
  • Economic policy
  • Health
  • Health Policy
  • Housing
  • India
  • Macro-economic policy
  • Real Fiscal Crisis of the State
  • Social Care
  • Starmer
  • Time for a Social Democratic Surge
  • Welfare State and social policy

Footer

Subscribe to Blog via Email

Enter your email address to subscribe to this blog and receive notifications of new posts by email.

Copyright © 2025 · News Pro on Genesis Framework · WordPress · Log in


Loading Comments...