Geopolitical pressures and risks have compounded the Real Fiscal Crisis of the State (RFCS): the mismatch between the public expenditure requirements of the UK (assuming a continuing public desire and demand for accessible and universal public services and social security on the European social democratic model) and the political and electoral willingness for them to be met through forms of taxation that are efficient, sufficient, and transparent.
Andy Burnham’s (AB) new government will need to juggle demands for additional defence investment with continuing increased social spending pressures within an economy unlikely to escape its secular slumber any time soon. The 2027 Spending Review (SR27) will not be a pretty one. The Autumn 2026 budget must prepare the ground for tough but necessary and ultimately positive strategic choices.
AB seemingly has committed to the preservation of the triple self-denying ordinance on not raising direct income tax, national insurance and VAT rates, as well as the existing fiscal rule framework, while also setting out the outlines of an ambitious domestic policy agenda that will require increased borrowing in the absence of effective tax increases combined with spending efficiencies.
Accused of a style trumping substance, as prime minister (PM) he will need to translate governmental vision into concrete outcomes that, on one hand, further Labour party base priorities; on the other, build up wider national and international confidence in his government’s economic and public finance management.
A change agenda must be set and progressed at pace, combining boldness, clarity of purpose, and delivery capability, credible and transformational enough to attract and achieve electoral support sufficient to win a further term of office for its completion, in the meantime crowding out the everyday noise that Reform and the right-wing leading media thrive and has hitherto thrived on when left with a policy vacuum to fill.
Tough calls, indeed, but if ducked his government will become the same simple self-imposed prisoner of events and such external pressures as Starmer’s proved to be, leading to paralysis and electoral oblivion and/or dependent on short term ephemeral gestures.
In line with that overarching imperative, it must recast and to better integrate the tax and spend narrative to economic efficiency and social fairness objectives. Shifting taxation towards property wealth and away from income and productive economic activity is a clear candidate for priority policy action.
Few, if any, dispute that council tax (CT), the main existing property tax based on 1991 values is patently absurd and unfair, generating a cross-party groundswell support for its reform.
CT is both vertically and regionally regressive – households properties pay proportionately and progressively less relative to their residential property value – and horizontally inequitable: households living in similar properties pay significantly different amounts.
At the same time, stamp duty land value tax (SDLT) inhibits beneficial housing market transactions, efficient use of land, and associated economic activity. It is often diagnosed as the ‘worst tax’ due to its distorting impact on transactions and market behaviour, for reasons this Tax Policy Associates paper summarises.
Yet, fiscally, it has become an increasingly important and rising tax revenue source (see section two). It simply can’t be wished away as Kemi Badenoch in her 2025 Conservative Party conference speech appeared to, committing to abolish (not tinker with rates) stamp duty, to make it ‘gone’.
The complete and simple abolition of SDLT would leave a gaping fiscal hole for any new chancellor to fill, manifesting in clear sight, the grip of the overarching RFCS.
Besides, as a standalone reform, in large measure, it would be capitalised into higher house prices, borne mainly by buyers rather than sellers, worsening housing affordability and compounding housing wealth inequalities.
A mildly progressive owner liable property tax is already in the Treasury policy development machine. It is waiting for him to take ownership of and then mould in accordance with his government’s strategic objectives. That opportunity must be seized.
The reform of both CT and SDLT consequently can, should, and must be linked.
A recurrent proportional (levied according to percentage of value) property tax progressively levied (higher percentage on highest valued properties) targeted at the housing wealthy could yield substantially increased public revenue and create some added fiscal space, allowing some dismantling of SDLT at its top end, as a first step towards its economically enhancing abolition.
It is that top end where many tax experts consider that SDLT is subject to diminishing returns, in a sort of ‘Laffer curve’ effect, evidentially discussed in another Tax Policy Associates paper invariably profitably read.
AB has previously declared sympathy to the principles of a Land Value Tax (LVT) to abolish CT and SDLT, as well as the cross-party supported Fairer Shares campaignto levy a 0.48% tax on property value (0.96% for on second homes and on foreign purchasers) for the same end.
That campaign’s banner claim is that 77% of households (18 million) will then pay less, saving £556 on average, with gainers spatially concentrated in the north and midlands, including Makerfield, AB’s constituency, whereas the losers would be concentrated in the London and the southeast, although annual losses would be capped at £1,200 for existing owners.
Many middle-class London homeowners in areas such as Putney, Battersea, and Tooting, could face a higher annual charge close to the proposed £1,200 cap.
Such an increased charge could also reduce their house value and equity, all other things remaining the same. They are a vocal and influential group, attracting headlines, such as Will Andy Burnham’s tax plan hit your home?.
That said, given the overall distribution of gainers and losers and the intensity of the patent and accepted distributional unfairness of CT, it remains moot whether such opposition could be politically faced down, especially, when combined with synchronised effective SDLT reform.
But at a practical level, a new property tax requires affected properties to be prior valued in a way that does not lead to manifold appeals that overwhelm the process.
The 2025 Autumn budget did introduce the High Value Council Tax Surcharge (HVCTS) – proposed as an additional banded (not percentage proportional) levy on properties valued at £2m and above, due to become operative in April 2028.
It is projected, however, to raise only £400m annually by 2029-30, a fiscally insignificant sum; on its own, seemingly hardly worth the effort.
The main argument made here is that its design should be improved and made more remunerative so to generate a greater contribution to the public revenues that could also allow a simultaneous or even presaging partial reduction of SDLT rates levied on higher valued property transactions.
Such reductions linked to a new proportional progressive property tax targeted to a small sub-group of wealthy property owners best able to pay, supported by deferments and other mechanisms for those relatively income poor, should help to offset, when capitalised, the downward price impacts of the new tax, while encouraging transaction and housing market activity and associated economic and housing system functioning.
It would be an effective template first step setting the direction of future reform on the Fairer Share model, perhaps partially regionally devolved.
The first section explains the proposed HVCTS, including proposed deferral arrangements, and the current SDLT structure.
The second section presents and reviews an alternative proposed proportional percentage progressive scheme that could yield upwards of £9bn annually before discussing possible adjustments that could enhance its political feasibility given the likely trade-off between that and its wider coverage, noting that a range of factors is likely to impact on its potential, and most importantly, outturn yield.
The third section makes concluding comments and recommendations, including that, while the new property tax should remain additional and supplemental to CT with properties valued, regardless of existing CT band, it should be converted and extended into an uncapped progressive proportional property tax, certainly at the highest valuations, and be linked to top end SDLT reforms, the first steps of which should accompany, if not precede, any such reform.
1 The High Value Council Tax Surcharge (HVCTS) and SDLT.
The 2025 Autumn budget announced the introduction from April 2028 of an annually reoccurring targeted High Value Council Tax Surcharge (HVCTS or surcharge) on owners of residential property worth £2m or more (in 2026 prices), updated to annual consumer price index inflation (CPI) from 2029-30 onwards, with revaluations conducted every five years.
Homeowners will be liable for HVCTS, not occupiers, who will continue to pay their CT regardless of band.
Local authorities (LAs) collecting HVCTS alongside CT will be “fully” compensated for their additional direct costs. HVCTS revenues received, however, will be remitted to central government to be redistributed back to them.
Local government expenditure in England in 2024-25, according to MHCLG data totalled c£134bn. Education (excluding academies) and social care (including adult and children) accounted for c£84bn of that total, with police, environmental and cultural services also accounting for large slices of expenditure. Nearly £5bn was spent on non-Housing Revenue Account (HRA) services (homelessness prevention, temporary accommodation and private sector interventions).
More than half of local authority revenue (54%) came from central government grants of c£72bn in 2024-25, compared to CT receipts of c£41bn. Locally retained business rates accounted for £20bn. The proportion of total local expenditure met by CT, however, has been slowly rising due to a combination of growth in its tax base and its charge levels, touching 31% in 2024-25.
The Treasury justifies HVCTS on the simple ground that a £10m property should not pay less CT than an ordinary family home, highlighting that a CT band D home in Darlington or Blackpool pays just under £2,400, whilst a £10m Mayfair property pays just over £2,000.
HVCTS is designed to rectify that glaring and long entrenched anomalous inequity by adding £7,500 to the Mayfair charge, making a total charge of £9,500.
Identified properties will be placed into four bands, based on their assessed property value, as Table One sets out below.
Table One: HVCTS Valuation and Charging Bands
| Threshold Band (£m) | Charge Amount (£) |
| 2.0 to 2.5 | 2,500 |
| 2.5 to 3.5 | 3,500 |
| 3.5 to 5.0 | 5,000 |
| Above 5.0 | 7,500 |
The Valuation Office Agency (VOA) will use up to date, not 1991-based, property valuations to identify all homes above the £2m threshold, regardless of their current CT band, given that some properties in CT higher bands that are worth less than £2m, while other lower banded properties are worth more than £2m: an example of the horizontal inequity noted earlier.
An Automated Mass Valuation (AVM) model based on transactions data from the Land Registry, including sales price, property characteristics and location attributes, before applying algorithms and statistical techniques is being deployed to produce estimates of values at a set time (temporal) point.
According to the government, AVM, which the VOA used to support the Welsh Government’s CT reform process, will provide a fair and consistent, as well as speedier and timely basis for valuations.
All properties possessing the same characteristics, under professional valuation oversight with contribution, will be valued in the same way, at considerably lower cost and a greater speed of valuation per property than has been previously possible.
HVTS should raise annually around £430m from 2028-29 onwards to support central government revenue funding of local government services, according to the HM Treasury.
The Office of Budget Responsibility (OBR) last autumn in its November 2025 Economic and Fiscal Outlook was more cautious, estimating in para 3.42 that it could yield c£400m by 2029-30, after it took account of a range of the behavioural impacts of HVTS as currently proposed, including that it would be capitalised on future transaction values and hence impact on future SDLT and capital gains tax (CGT) proceeds.
It also assumed that proceeds would also be affected by the bunching of sold properties just under each successive banding threshold, as well as by appeals and distortionary non-compliant behavioural responses from affected owners seeking to avoid, for example, a higher annual charge of £3,500 rather than £2,500, if their property was valued at £2.55m not £2.49M.
Outturn HVCTS yields will also depend upon future policy decisions on the details of any adopted reform.
Adam Lawrence has already highlighted one: the tax deductibility or not of the annual property charge for buy-to-let (BTL) owners. If HVCTS is treated as an operating expense, deductible in full against rental income, then a large chunk could be taken out of posited receipts of the HCTVS scheme or any variant or alternatives that section two discusses.
The Treasury must decide whether the new charge should be treated akin to mortgage interest, which section 24 of the Renters Reform Act restricts to a basic-rate tax credit, deducted from the net rental income taxable liability of the landlord, regardless of whether they are a basic, higher rate additional taxpayer, with that net liability then taxed at 22%, 42% and 47%, respectively.
HVCTS, like CT, does not target higher valued properties when the highest £5m threshold is exceeded: properties worth more (perhaps at the extreme top end more than £60m) will not pay more than £7,500 that, accordingly, becomes a payment cap for no discernible efficiency or equity reason.
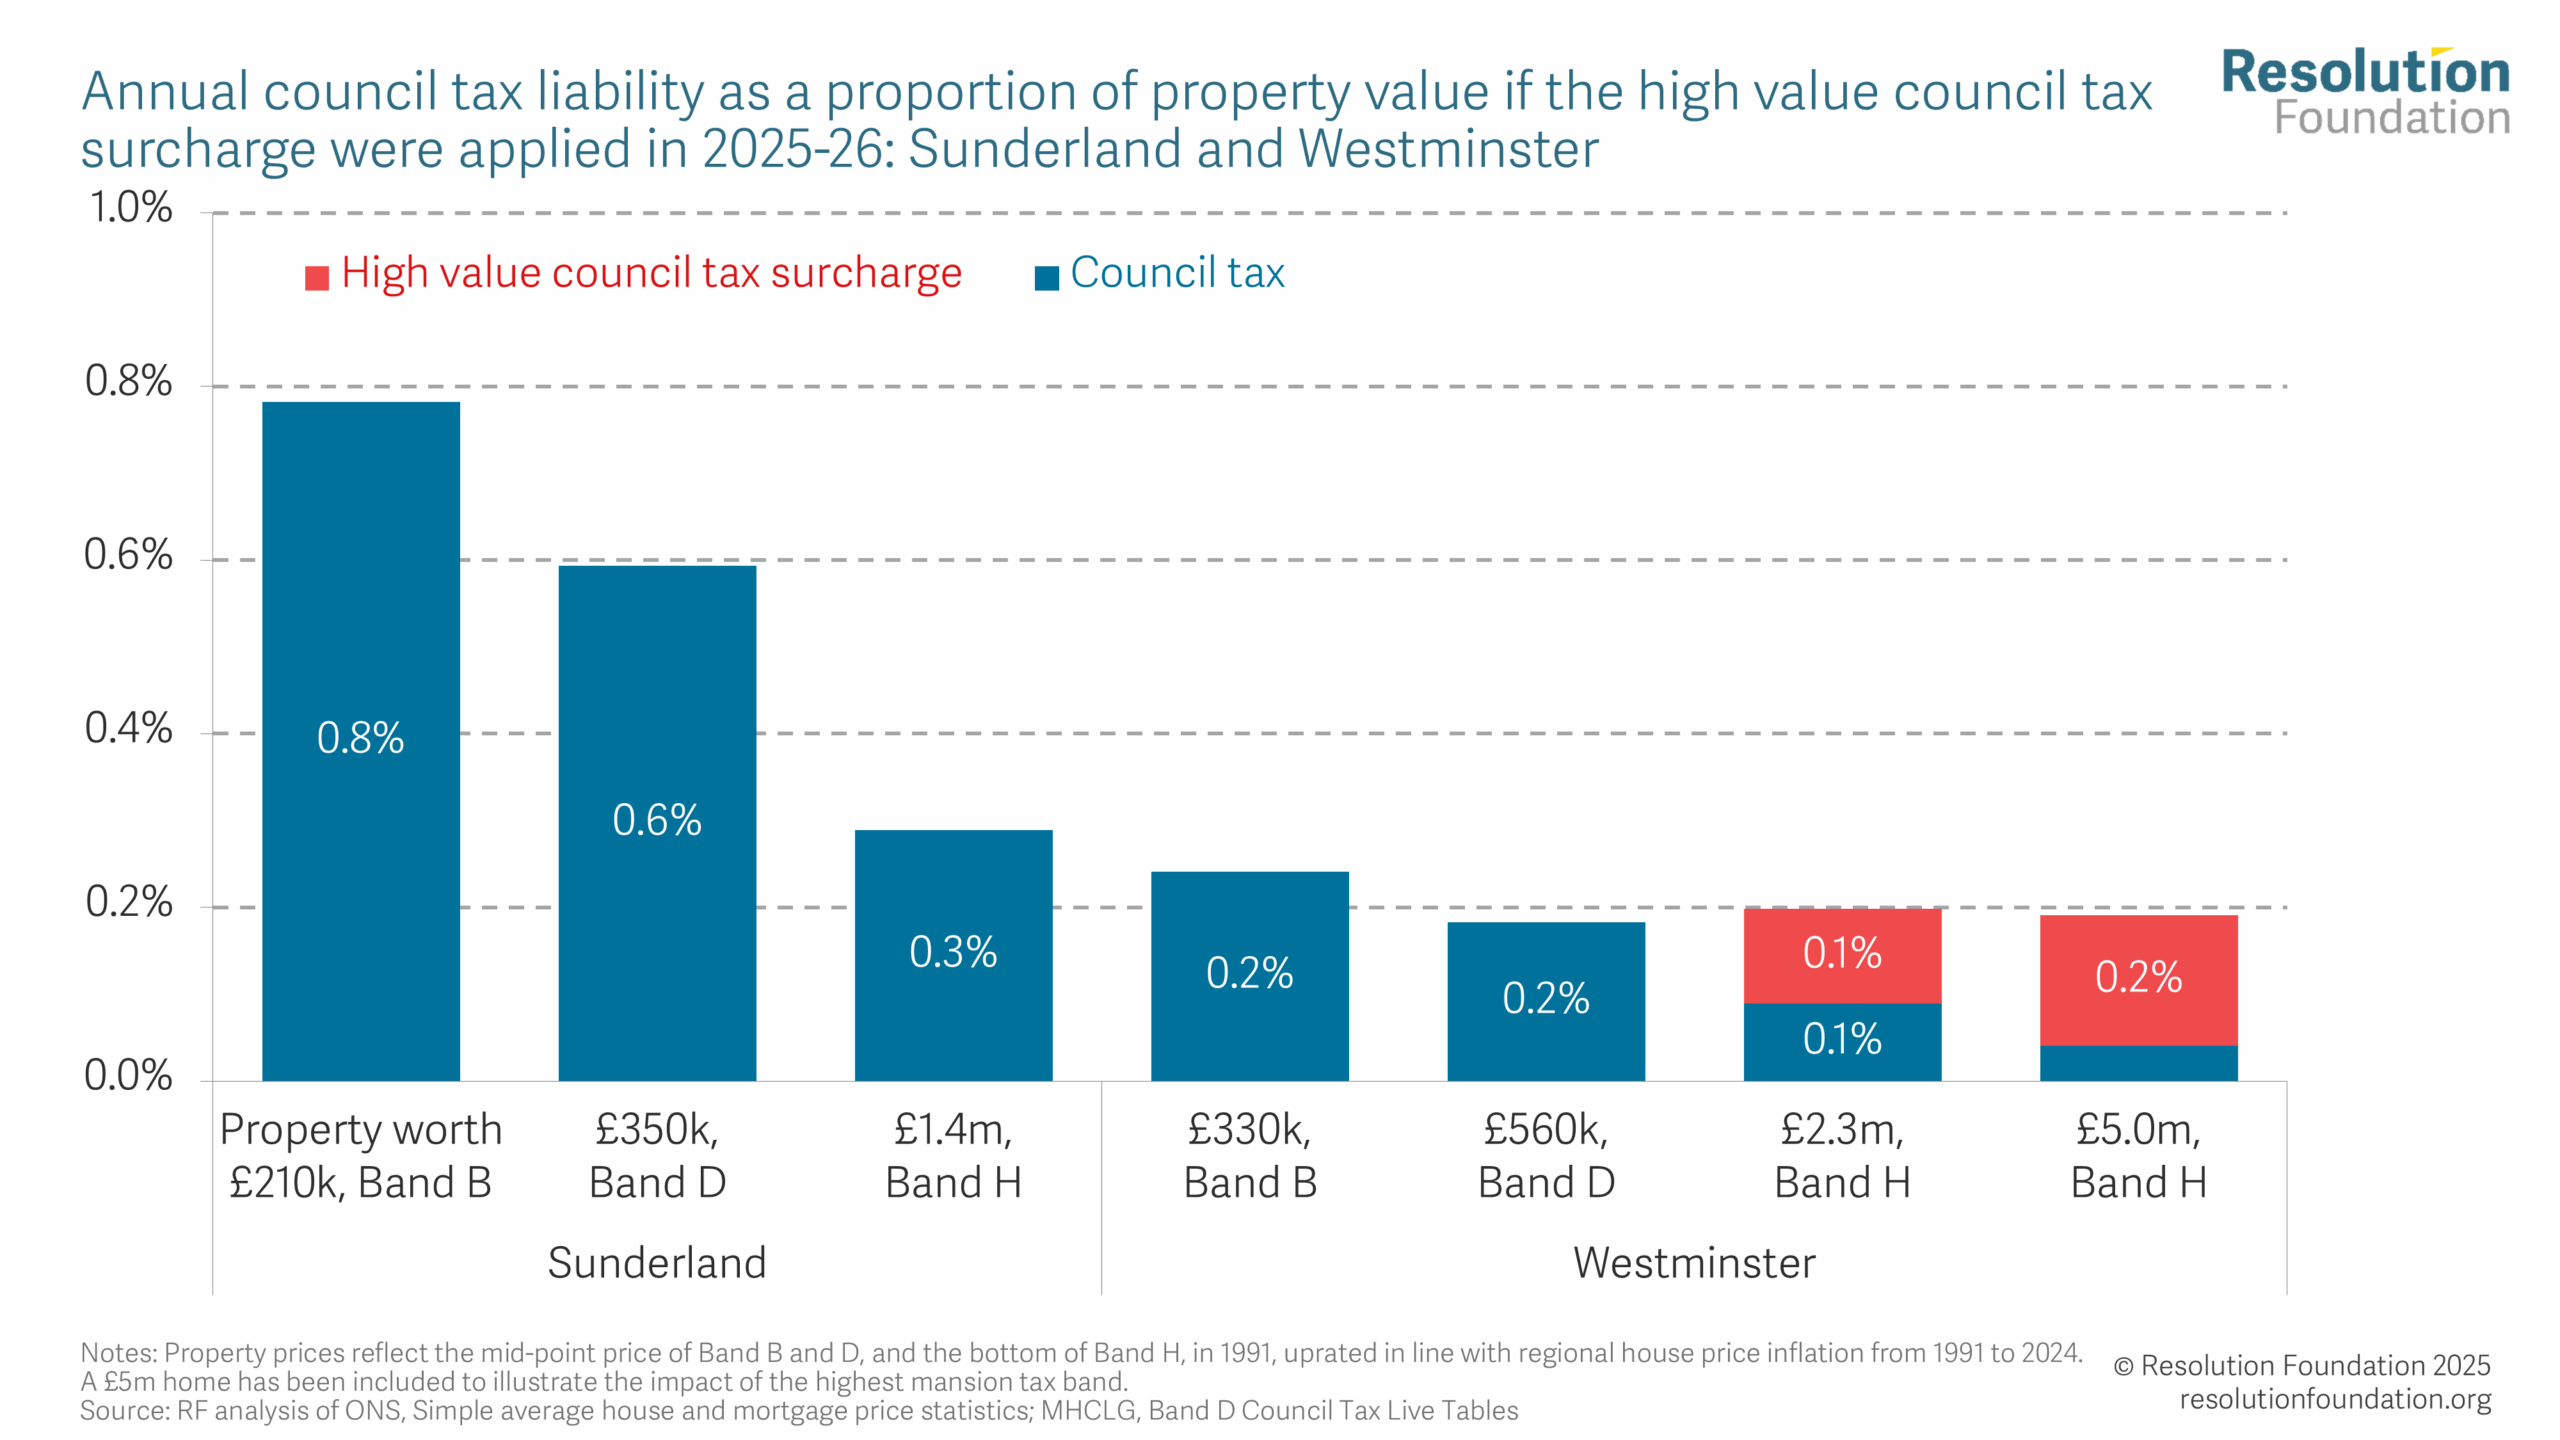
Although the vast majority (around 90 per cent) of properties affected will be in London and the Southeast – the areas where decadal real house price inflation has been most concentrated – the Resolution Foundation (RF) shows that the surcharge will still only result in high value properties in Westminster paying 0.2% or less of property value, compared to the 0.8% currently paid by Band B and the 0.6% paid by Band D occupiers in Sunderland.
Put bluntly, HVTS, as currently designed, will only scratch the surface of the rank inequity and unfairness of the current CT system, raising only token amounts of additional public revenue, which will hardly make a dent into the current crisis of local government finance, let alone the overarching RFCS.
To make a more substantial inroad into that and other manifestations of the RFCS, a proportional progressive tax, on the model variants that section two will shortly outline, is required.
Deferral and support mechanisms
An argument deployed against increased property taxation is that it would be unfair on income-poor owners, causing undue distress to elderly and disabled households, while a sudden big jump in annual recurrent tax liability could cause more general budgeting problems for some households, especially recent purchasers.
In response, the Treasury consultation on the HVCTS that closed on the 14 July confirmed that the right of deferral of HVCTS charges will be made available to personal owners for their primary residence, where they meet specific criteria.
In terms of eligibility or qualification for deferment, it proposed a household £35,000 income limit, as per the winter fuel payment entitlement cut off, and a £16,000 capital saving limit aligned with pension age CT support.,
An alternative option the consultation offered, was for qualifying deferral income and capital thresholds to be aligned with universal credit (UC) or pension credit (PC) entitlements.
It noted, however, that would be complex for the local authorities (responsible for assessing deferral as well as collection) to administer, insofar that UC has no single income threshold whereas PC uses multiple income and capital rules.
HVCTS deferral applicants will be required to submit evidence to allow their collecting LA to assess eligibility, including their income, savings, and pension information.
Deferral will also be made available “in certain circumstances”where the property is the main home of a disabled or a “severely mentally impaired” person, with eligibility possibly based on the same criteria currently used for equivalent CT discounts and exemptions.
The local administration of HVCTS deferrals will operate in a similar way to Deferred Payment Agreements (DPAs) that LAs administer for adult social care, including three key features.
First, the individual must have sufficient equity in the property to ensure deferred payments can be recovered. For DPAs, local authorities can allow deferred amounts up to 90% of the value of the asset, minus any existing charges (like a mortgage), less the lower capital limit for social care support.
Second, interest for DPAs is charged throughout the lifetime of a deferred payment. The interest rate on HVCTS deferrals will be set at a national level.
Third, a charge is taken on the property to secure deferral debt, ensuring that it is paid when the property is sold.
In its response to the consultation, this website argued that while recognising that the greater the incidence of deferral, the greater will be the short-term hit on the short-term tax yield, the need to convert and extend the HVCTS to raise more revenue, as section two discusses, tends to supportthe adoption of a simpler equity-based deferral scheme less subject to stringent means testing, perhaps involving a deferral addition to the percentage rate, rather than complex interest rate adjustments, as more properties come into its ambit at higher charges.
Certainly, any deferral schemes should allow some flexibility to mitigate cases of potential hardship outside strict means-tested eligibility.
Stamp Duty Land Tax (SDLT)
SDLT is charged on a graduated ‘slice’ basis, like income tax. Prior to 2014, it was charged on a ‘slab’ basis. Successive higher rates were levied on the whole value of the sale, rather than the just the part of the price within each defined threshold slice. Rates and proceeds since the millennium increased significantly.
In 2016 a new higher rate of tax was introduced for purchasers already owning a residential property (additional rate).
First-time buyer relief, however, was introduced in 2017.
A temporary SDLT ‘holiday’ in response to the Covid pandemic was introduced in July 2020 and ended in September 2021.
In September 2022, Liz Truss’s chancellor, Kwasi Kwarteng, announced a permanent reduction to SDLT. The first nil rate ‘slice’ of the property price was doubled to £250,000.
Jeremy Hunt, the new chancellor appointed by Rishi Sunak after the brief Truss hiatus, in November 2022 announced that Kwarteng’s reductions would be temporary. They ended on I April 2025.
From April 2021, a two per cent surcharge has been applied to UK non-resident purchasers of residential property in England and Northern Ireland, increased to three per cent since October 2024.
The single rate of SDLT payable by companies and otherwise defined non-natural persons purchasing residential properties worth more than £500,000 was also raised from 15% to 17%, effective after 31 October 2024.
Rising rates apply to different portions of the overall property price above set thresholds. These, however, vary for different defined groups, as Table Two sets out.
Table Two: SDLT rates, England, 2026-27
| Property value (£) | SDLT rate (%) |
| Non-first-time buyers | |
| Up to £125,000 | Zero |
| £125,001 to £250,000 | 2% |
| £250,001 to £925,000 | 5% |
| £925,001 to £1.5m | 10% |
| Above £1.5m | 12% |
| First time buyers | |
| Up to £300,000 | Zero |
| £300,001 to £500,000 | 5% |
| £500,001 and above | Non-first-time buyer rates apply |
| Additional property higher rate (HRAD) | Plus 5% on non-first-time buyer rate |
| Non-UK resident surcharge (NRSDLT) | Plus 2% on applicable first time or non-first time and additional property rates |
| Single rate payable by companies on property purchases above £500,000 | 17% |
SDLT on residential property raised £10.4bn in 2024-25 (all figures rounded to nearest £100m), the last operative year of the Kwarteng reductions.
Its receipts are a function of residential property values and transactions and the rates charged. The OBR in March 2026 forecast them to rise to £19.1bn by 2030-31. SDLT is clearly a potentially buoyant tax of rising importance to the exchequer.
Because of its sharply graduated structure, where buyers able to purchase more expensive properties pay progressively more tax, its reliefs for first time buyers, its nil rate, and its additional rates and surcharges, SDLT is a progressive tax (if and when a transaction occurs), especially for additional home or buy-to-let purchases, and if purchasers are non-resident.
Her Majesty’s Revenue and Customs (HMRC) Annual Stamp Duty Data (Table 6a) and reported that three million of the total £10.3m SDLT receipts in 2024-25 came from properties sold for more than £1.5m, compared to the £3.3bn that came from property transactions in the £500,000 to one million price range, reflecting the higher number of properties sold in that value range.
Higher rates on additional dwellings (HRAD), in 2024-25, in total raised nearly £5.4bn, (Table 5c) more than half of the total SDLT receipts for that year.
HRAD, according to the latest 2026 Stamp Tax commentary, was £870m (19%) higher than previous year, reflecting the uplift to the HRAD surcharge rate from three to five per cent and by forestalling effects, where buyers brought forwards purchases before 1 April 2025, when the previous temporary SDLT holiday ended.
The non-resident surcharge (NRSDLT) raised of £1.1m, £80 million (7%) lower than the preceding year.
London provided the highest amount of 2024-25 SDLT receipts, £5.1 bn (37% of total SDLT receipts).
Besides and related to its wider economic distorting impacts, SDLT, although progressive, as and when levied, is also horizontally inequitable between owners that do and do not move, for whatever reason.
2 Alternatives to HVCTS
Professor John Meullbauer of Oxford University and longstanding fellow of the British Academy over many decades has been a leading international expert on the interaction between housing, financial, and wider economic systems, both domestic and international, whose latest major contribution (Muellbauer Feb. 2026) to UK housing system reform includes detailed work on property tax reform that is especially directly relevant and timely.
His ultimate goal is a Green Land Value Tax (see section 6.4 of referenced above link), albeit involving a split-rate property tax, comprising separate charges on the underlying land and building of a property footprint (higher on the land component), minus a discount based on each property’s (taxable unit) carbon emissions, as measured by its energy performance certificate (EPC).
In July 2026, Dan Neidle of Tax Policy Associates published a detailed modelled proposal (Neidle proposal) for a Land Value Tax (LVT) to progressively replace CT and SDLT over a ten-year period.
It would thus be sensible to stocktake taking the LVT route first.
Land Value Taxation (LVT): opportunities and problems
Land value taxation (LVT) has a long pedigree based on its key positive efficiency advantage – that is in its pure form as an annually reoccurring tax on a factor of production fixed in supply (land is finite and immovable) means that its imposition on unimproved land does not distort decisions on its subsequent use but rather encourages its most productive deployment, with its incidence borne by the owner.
In practice, however, the supply of developable land can vary with planning and other institutional arrangements. An effective LVT also requires each land tax unit to be valued – a complex, challenging, and contestable exercise.
Even if it were administratively feasible to implement a LVT in one go, huge value disparities would result is massive changes in tax liabilities that, it turn, would then necessitate complicated and possible distortive and extended transitional and phasing-in arrangements to mitigate (see Time for a Modern Land Tax? for a detailed discussion on LVT issues, opportunities and problems).
For these and other reasons, LVTs internationally have tended to be limited in coverage and incidence involving, rather than a pure LVT, a composite property tax or a split-level property tax, where the building and land is taxed separately, which, when applied has been set at a low and sometimes (as in Denmark) reducing level (see above referenced link for detail).
The Neidle LVT proposal itself recognises that, although most will gain, it will involve very substantial tax increases for some, particularly in London. The prospect of a sudden capitalisation shock that, overnight, would also greatly reduce property prices in some parts of the country, such as Kensington and greatly increases them in others, such as Blackpool.
To mitigate them, the Neidle LVT would be phased-in over ten years (indicating a need for a supporting cross-party consensus on its implementation, which, however, remains very much absent) with exceptions, such as for social housing owners.
There is not space here to do justice to Neidle’s proposal, which should be carefully read by all interested parties. But, cutting to the chase, it simply is neither feasible nor practical, as his own balanced, nuanced, and informed analysis, on close reading, tends to suggest.
In short, the losers would be too many and politically salient during a prolonged politically contestable lead-in period, clearly sensitive to media manipulation; practically, the necessary valuation exercise could take years to allow even the transitional introduction of such an LVT.
The HVCTS is already in train and already includes some features, such as prior valuation, and owner rather than occupier liability, that are potentially consistent with a longer term shift towards LVT treatment.
Insofar that it could be substantially tweaked this autumn to further AB’s proclaimed priorities, mutating to a proportional, even progressive, property tax, in a politically feasible form, seems the practical and sensible way forward.
A progressive proportional property tax
Consistent with that, Muellbauer puts forward (section seven of referenced link) a more immediate two-pronged approach to the fairer taxation of property, involving a precise targeting of new property taxes capable of raising substantial additional public revenue without increasing the tax burden for most voters (set out in section seven of Muellbauer, 2026).
House prices are a weighted average of land prices and housing construction costs (with the volatility of the former greatly exceeding that of the latter.
The proportion of value taken by the underlying land rather than the building generally rises with property value. It is relatively high in England, most markedly in high value areas, concentrated in London and its surrounding areas.
In effect, a proportional progressive property tax in England would mimic or proxy a LVT (at least in its high value areas) with its incidence falling mostly on properties with the highest land values.
The first prong is linked tax reform to CT and SDLT covering the two most expensive CT bands, Gand H, involving a proportional and progressive percentage property tax. Band G properties account for 3.54% and band H properties 0.60% of the stock of properties in England.
The second prong is a LVT on the most expensive land, including unoccupied developable land.
The first prong: linked CT and SDLT reform
This prong comprises three linked elements.
1. CT across the current top two bands would be replaced with an annual property recurrent tax of 0.5 percent of property value, covering 1.14m properties in England and Wales.
2. For non-UK owners and owners of second homes in the top two CT bands, the rate applied would be double that standard domestic rate, at one per cent of property value; simultaneously, the top SDLT rates would be reduced to five per cent from 12% for primary homes and 17% for second homes.
3. Given the differential distributional impact of the proposed SDLT reduction on higher value owners (point two), on distributional and on overall yield grounds, a further 0.5 percent surcharge on property values over £3m for all owners would also be levied.
This because the regressivity of CT and the progressivity of SDLT requires their reform to be linked or integrated to make the reforms of both politically and fiscally palatable (see section 6.3 and figure eight of Muellbauer Feb. 2026 and his modelling work referenced below).
Accompanying detailed modelling work estimated the net revenue impact of these proposals.
It involved uplifting the 1991 values of band G and H bands properties up to 2025 market values.
Regional house price indices and other methods were mainly used to estimate band G current values, and Land Registry transaction data for band H values.
These estimates were then adjusted to reflect the expected higher propensity of such higher-banded homes to be second or foreign owned (thus attracting the higher one per cent rate of the new proportional property tax).
Because of high SDLT rates, the highest valued band H homes tend not to be transacted, likely causing their inflated values to be under-represented in the Land Registry data. Allowance was also made for that propensity, as well as for the impact on values their related likely greater incidence of improvement since 1991(basements into gyms or even cinemas, for instance).
On the back of this modelling work, Muellbauer (M) estimated that the net revenue gain of his linked CT and SDLT proposals could be expected to exceed nine billion pounds annually.
What about the financial impact of reducing the top level SDLT down to five per cent?
Whilst such a large drop in top level SDLT rate would ostensibly subtract from the total net new property tax yield, in practice, outcomes, amongst other factors, would depend upon whether enhanced transaction volumes it spurred (reduced buyer SDLT liability should be capitalised upwards in selling prices) would offset or surpass the resulting lower SDLT takes per transaction, or not.
M in an accompanying Question and Answer (Q&A) document on his proposals, expects the cut in stamp duty to reduce revenue per top level transaction, but their volume to commensurately rise sharply, noting that “purchases of houses in bands G and H by homeowners in lower council tax bands will be catalysed by far lower stamp duty costs, more liquidity in the market for band G and H properties, and a moderate fall in their prices”, noting that the proposed SDLT reduction should rekindle transactions most for the highest valued properties (Q14).
Under M’s linked proposals, the foreign or additional owner of, say, a £7m home would annually pay £90,000 property tax (one per cent rate on entire value plus 0.5% high value surcharge on the £4m portion of its value over £3m).
But future purchasers of such a property would pay £517,000 rather than £1.235m in SDLT, £717,500 less as would be incurred under current arrangements (assuming that a seven per cent SDLT would now be levied on the £6,075,00 value portion above £925,000 – five per cent plus continued two per NRSDLT addition).
For a £2.5m property, the corresponding revised SDLT liability would be £202,500, reduced by £177,500 from £380,000 at current rates, compared to an annual property tax charge of £25,000.
The unknown is the extent that transaction activity for properties above the existing £925,000 upper threshold for five per cent SDLT in response to the SDLT cut.
To be revenue-neutral, transactions for the highest valued properties in the millions would need to progressively double or treble.
At a wider systems level, in M’s reading, increased transaction activity (presumably mostly across the £925,000 to £2m range) should allow some owners to move up the housing ladder, creating further vacancy and transaction chains, pushing SDLT receipts up across the lower bands (where SDLT rates would be unchanged).
Once the price adjustments to the simultaneous property tax and SDLT changes stabilised, several economic and housing market benefits should follow. Fewer expensive properties bought by international investors would be left empty for long periods, increasing effective housing supply.
Falls in their values, notwithstanding lower rates of SDLT, should make them more affordable for high earners, improving their job mobility, boosting future employment and income tax revenue.
A permanent shift in developers’ incentives, away from top-end luxury housing should occur.
Together with lower local land prices in high value areas (assuming that the future present value of the tax would be capitalised downwards into future residential land values, see below), housing affordability should be improved more widely, especially for young families.
Overall, M concludes, the wider ensuing economic and housing system gains could be massive.
The second prong: LVT on farm, forest and unoccupied land scheduled for development
Muellbauer also proposesa land value tax on the value of farm and forest land, and all unoccupied land, such as land scheduled for development, levied at a rate of one percent on value exceeding £40,000 per hectare, generating estimated annual levels of receipts of c£5bn.
The £40,000 threshold would leave most farmland exempt. For transparency in establishing land values, including ‘hope value’, options on land should be registered at the Land Registry.
The issue and problem that this part of the package attempts to address is a real and fundamental one.
Rocketing residential land values across high demand areas reflects the housing unaffordability crisis.
Without effective mechanisms to ensure public land value capture of the economic rent or windfall component of the massive multiple increase in land value that often follows change in planning designation, government efforts to secure both a step change increase in housing supply and improved access and affordability, using Land Value Capture (LVC) will be stymied.
Kate Barker, in a seminal planning and housing review for Gordon Brown, when he was chancellor, then also recommended a site value tax on vacant brown and greenfield land, postulating that such a tax would provide an incentive to develop such land in its most productive use (chapter six, Housing, Where Is the Plan, Perspectives 2014).
Yet, at the same time, she also pinpointed implementation and timing challenges associated with taxing undeveloped land based on its zoned or site planning allocation valuation (current planning designation).
This is because liable values would depend on planning decisions, in part, beyond the control of the owner, and went on to question how ‘hope’ values on land not planning designated for development could be valued for taxation purposes.
Alternatives could include other proposals included in Muellbauer Feb. 2026, including public land value capture facilitated by strengthened compulsory purchase powers, disregarding hope value.
Deferral arrangements
M emphasises (section 6.2 of referenced contribution link) that simple deferral arrangements must constitute a key element for the public acceptance of property tax reform.
This is because property tax reforms linked with property values and revaluations inevitably run into the problem of cash-poor but property-rich households.
He proposes a simple, equity-based deferral scheme, not involving interest rates, nor one severely means tested, as was suggested by the Treasury consultation relating to the proposed HVCTS deferral system that section one outlined.
Without delving into the detail, at first glance, a possible problem with a simple equity deferral is that it might be expected to be popular (if not attached with accompanying deferral costs, whether interest rate calculated or not) possibly substantially reducing the short-term yield of the tax, although the contingent future financial benefit could and should be treated as an asset for fiscal rule purposes.
Clearly, how widely the eligibility or coverage for deferral would be set and at what deferral cost would be key.
In his other publications, such as this, M has suggested that every pensioner household would have the right to defer the property tax, but at a slightly higher charge rate (0.6%) than a cash-payer (0.5%) – meaning, in effect, that the deferred annual charge would be 20% higher to reflect the benefits of deferral.
Although he allows for the right to deferral to be means-tested to assist poorer households, the simpler equity-based deferral could, M suggests, could also be offered to all non-pensioners households but at a higher ultimate deferral cost compared to that offered to pensioners. Alternatively, a comparable discount on the tax due could be offered in return for upfront payment.
HMRC would register a proportionate interest at the Land Registry equal to the unpaid tax for each year deferred, which would be settled when the property was sold or transferred. For example, with a 0.6% tax, after ten years of deferral, the property owner would retain 94% of the then-current value of the registered property title.
According to him, this ‘proportion of equity’ deferral model would be easy for taxpayers to understand, involving them simply ticking a box on the property tax form requesting deferral, without any means test, and without complex interest rate calculations.
However, that implies that the scheme would be administered by HMRC rather than LAs.
A possible alternative
The recurrent annual c£9bn revenue gains offered by M’s package (M) are based on the levying of the proposed proportional progressive property tax on existing properties that were placed in bands G and H in 1991, rather than with reference to the Treasury proposed HVCTS qualifying current value £2bn threshold, assessed by AVM, regardless of band.
M’s modelling (see previous referenced link), allowing for uncertainty and estimation error, suggests an estimated updated band G average value of £1.32m and average band H value of £3.36m, respectively. Liable property values will be dispersed around such averages, with the majority below them.
His proportional 0.5% tax on primary residences and additional and higher valued would be levied on the estimated current total value of liable properties.
Table Three below indicates (column b) that this would be associated with a £6,600 gross annual primary residence charge on a property valued at £1.32m, compared to an average 2026-27 band G existing CT charge of c£4,000, suggesting a net higher charge of c£2,600, as liable properties under the M package would no longer pay CT.
Table Three: New Property Annual Tax Receipts, by model
His linked proposal to reduce top end SDLT to five per cent – the rate currently levied on properties valued in the £250,001 to £925,000 for non-first-time purchases (see Table Two) – is consistent with some properties valued at £925,000 (£4,625 gross annual tax charge @0.5%) and above, and, perhaps, even some owners below that level, becoming liable for the 0.5% or one per cent new tax payable on the entire assessed value of the property.
This could risk extending liability for the new tax to the point of risking political infeasibility.
Its direct short-term financial impacts at those house price levels appear not dissimilar to the Fairer Shares model that the introduction outlined, seemingly possibly contrary to M’s own design principle that to minimise the political push-back, a precise targeting of the tax is required leaving property taxes for most voters unchanged.
Narratives such that “we recently bought our c.£925,000 London home, which is not much more than the local average price and this new tax will be difficult to meet given our high mortgage commitments at our family cycle stage, given the cost of childcare, school fees, etc”, are sure to be picked up and propagated as attacks on aspiration by the mainstream media, notwithstanding their special pleading tinge in the context of the acute living of crisis faced by many lower down the income scale.
That said, prospective buyers of former band G and H properties of around £900,000 in current value, under M’s package, would still face the same SDLT rate that multi-million properties under M’s linked proposal would now face, given that top level SDLT would be reduced down to the five per cent payable across the £250,000 to £925,000 property value range (see Table Two).
A fundamental design aspect of M’s new property tax is that would apply only to existing CT bands G and H properties, which it would replace, presenting two main problems.
First, as noted previously, it is likely that many lower-CT banded properties are now valued above £925,000; in general, the relationship between current values and CT bands will have substantively weakened and decoupled since 1991.
Second, and related to the first, the Treasury HVCTS valuation process is being conducted on property value regardless of existing CT band, which seems a more equitable and sustainable approach.
However, if the new tax did not replace CT bands G and H, the increased annual charge resulting from the new and now standalone 0.5% or one per cent rates (as Table Three above shows) would now be net not gross, further increasing household budgeting problems and associated political feasibility problems for such properties, of which there are not an insubstantial number in London and other high value areas.
A possible response to relieve that would be introduce a starting threshold of £1.5m, with the new 0.5% tax proportionately applied only on the portion of property value above that threshold.
Column c of Table 3 models such a variant, which, in effect, would result in the new charge in the £1.5-2m range slowly rising to the HYCTS currently proposed level of £2,500 for properties banded in the £2-2.5m valuation range, whose owners would continue to pay CT.
However, as it is a proportional rather than banded tax, charges would rise proportionately for properties valued above two million.
As column c shows, an owner of a £2.5m property would now pay an additional £5,000 annually, (£10,000, if an additional or BTL property) double that of the proposed HVCTS charge (which does not distinguish also between primary and additional homes) but £3,500 less compared to M’s proposal with no assumed £4,000 CT to pay, where it was a previous band G or H property.
Such an adjustment would make inroads into the estimated £9bn yield of M’s package.
Although the starting value threshold (whether set at £1.5m or £2m), put another way, the new property tax tax-free allowance, could be tapered off at higher values to mitigate its deflating yield impact, such further adjustments, however, would come at the cost of added complexity.
The underlying issue is that the highest valued properties are a volume tail; most liable properties will be bunched or concentrated in the lower ranges.
There is thus a trade-off between maximising revenue though coverage (but greater the coverage, the more losers, paying more, are generated) and political salience and feasibility.
M reports that around 1,062,000 existing band G and H properties in England and Wales.
In sharp contrast, only around 165,000 properties in England, according to OBR modelling, are expected to be liable for HVCTS in 2028–29, although that tentative estimated number would significantly increase if the threshold is reduced to £1.5m, as recently speculated.
Leaving aside possible HYCTS under-estimation error, such a massive disparity reflects the greater coverage of M’s proposed property tax based on existing band G and H bands on properties valued below £2m, bunched around a million in value, with many below that.
3 Concluding comments
The potential scale of the increased revenue that could be generated by a proportional property tax requires the basic structure, as well as the details, of the HVCTS to be considered very carefully by any Burnham-led government during the crucial run up to what will prove a pivotable Autumn 2026 budget process.
Given AB’s policy ambitions and self-imposed continuing self-denying pledges not to increase direct taxation rates, it will certainly need an additional property-based revenue source yielding considerably more than £400m.
HVCTS, however, now provides a strategic policy Treasury-led property tax reform tramline although not quite ‘oven-ready’ that can be further adapted and extended, using intensive and effective use of AVM prior valuation – a precondition of effective property tax implementation.
In that light, it would seem sensible to retain the best features of HVCTS currently subject to AVM, namely its focus on the highest valued properties, regardless of their current council tax band, and the five-year revaluation cycle with intervening indexation, indicating that rather than a new property tax replacing the two existing highest CT bands, that it should continue to be supplemental and separate to CT.
But instead of a banded structure attached with a cap, the new tax should, as M proposes, be proportional and progressive to property value and be firmly linked to SDLT reform, starting at the top end.
Some adjustments could be necessary to render it more politically feasible such as the £1.5m starting threshold (in effect a tax-free allowance) variant to M’s linked proposal that section two explored, assuming retention of CT bands G and H.
The additional yield that it would generate will vary according to its final decided coverage and a range of other factors, as well as behavioural outturns.
Some will be contingent on Treasury decision, such as on the deductibility issue the introduction discussed. The sensitivity of transactions to top end SDLT reductions (lower revenue per transaction be offset by increased volumes) is likely to prove one key behavioural determinant that at the end of the day will come out of the wash.
The Treasury argument against a proportional tax is that the inexactitude of point, in contrast, to banded valuations would generate a much higher unmanageable volume of appeals, compared to the proposed HVCTS banded structure.
This, according to the 2026 HVCTS consultation document (see previous link), “prioritises simplicity for taxpayers and stability in the tax base”.
Certainly, for implementative prospects and outcomes simplicity is a virtue in tax and policy design. Yet, it is far from clear that Treasury reasoning in this case is correct.
As M points out, an owner whose home is below the average value for a band, especially when close to lower end of the band can be expected to appeal, as the financial cost of being wrongly classified one band too high can be great, especially where bands are wide (q8,Q&A).
Under HVCTS, owners with properties with values close to £2m can be expected to appeal if put in the £2.0 to £2.5M band in that they then face an annual £2,500 charge compared to a £1.95m owner with no liability; if a proportional tax approach was adopted, 0.5% of each £100,000 variation in value would be £500.
Liable owners could also be provided with an incentive to accept valuations, offering a discount on the annual charge of, say, five per cent for prompt acceptance.
Undoubtedly, the resourcing of the AVM valuation exercise will need to increase to produce point rather than banded valuations across a wider coverage of liable properties, but the resulting revenue gains should justify the added cost.
Unless the introduction of a revised HYCTS is postponed, the prior valuation requirement, however, will set a limit on to what extent its coverage can be extended when combined with a shift to a proportional percentage rather than banded structure.
That said, given the fewer number of higher valued properties, say above £3m, there seems to be little justification to use a banded rather than progressive percentage approach, even on the Treasury’s own terms, especially given the need to link property tax with SDLT reform, involving early reduction at the top end.
Another issue to be addressed is that an extended property tax can be expected to be associated with increased incidence of distressed relatively low-income owners, hamstrung by high mortgage repayments and possibly facing a capital loss if they purchased recently.
M’s proposed deferral and support measures are wide and flexible but could compress the near-term income yield of the new tax, while the Treasury’s consulted proposals appear overly restrictive.
In short summary, this post recommends that the proposed banded and capped HVCTS is converted and extended into an uncapped progressive property tax, certainly at the highest valuations, linked to top end SDLT reforms, the first steps of which should accompany, if not precede its introduction.
If you have any comments or wish to request a pdf hard copy of this post, contact asocialdemocraticfuture@outlook.com


